What to read first
Prioritize HALO and the RCA tool-design study. HALO turns different latency targets across LoRA services into scheduling headroom while reducing sequential execution of base-model and adapter computations on the GPU. The RCA study holds the diagnostic setup and model fixed to examine how tool abstraction affects localization, failure-type identification, and cost. Both show why stronger or more numerous components do not automatically improve end-to-end outcomes.
Three shorter readings examine different parts of reliability: HarnessTester strengthens tests for code that handles model outputs, StateWise repairs invalid memory before an action, and UndoBench separates nominal task completion from safe fault recovery. They offer mechanisms and evidence at different levels, not ingredients for a universal reliability score. The useful question is where an improvement occurs and what observations establish it.
Featured readings
01 · HALO: Turn relaxed deadlines into schedulable capacity
From Overloaded to Guaranteed: High-Throughput Multi-SLO Enforcement for LoRA-Assisted On-Premise LLM Deployment
Zeshen Zhang, Han Zhao, Weihao Cui, Quan Chen et al.; with Minyi Guo · 2026-10-04 (UTC)
Requests in the same batch need not run equally fast
An on-premise server can share a base model across several LoRA services, but it also places different businesses into a common batching queue. If every request decodes in every iteration, relaxed services occupy slots needed by urgent arrivals. Enlarging the batch can instead violate tight inter-token deadlines. Arrival-order or fairness-based queueing alone does not fully exploit these differences.
HALO addresses computation and scheduling together. On the compute side, it partitions GPU streaming multiprocessors between base and LoRA layers so they can run concurrently during decode. At initialization, a searcher profiles performance for different batch sizes, adapter insertion points, and hardware, then adjusts partitions using feedback rather than assigning one fixed ratio everywhere. This targets decode overhead; it does not directly accelerate prefill, where the LoRA computation already has high utilization.
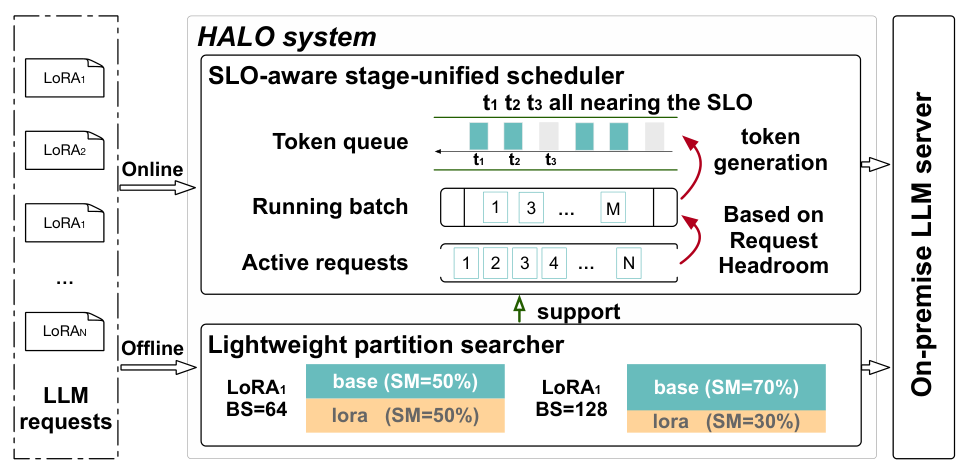
Reading the diagram: the lower component finds SM partitions for base and LoRA layers; the upper component selects requests according to headroom and queues generated tokens for delivery at their target pace.
Generate early, deliver on schedule
The scheduler separates token generation from output. Tokens generated ahead of time under light load are buffered and released according to service targets, creating a reserve for later bursts. Request-level slack estimates how long a request can pause. Decode requests with sufficient headroom yield slots to requests approaching TTFT or TBT deadlines, with prefill and decode managed together.
For example, a request allowing a 100 ms inter-token interval can potentially participate every other iteration when an iteration takes 50 ms. This illustrates the scheduling logic, not a guarantee under arbitrary load. HALO also accounts for capacity according to deadlines and orders queued requests by earliest deadline, preventing deferral from being mistaken for unlimited capacity. Unlike methods that only reorder waiting requests, it changes participation after requests have entered the running batch.
Read the gains together with the trade-offs
The authors evaluate an implementation in SGLang v0.5.4. Llama3-8B uses one 80 GB A100; Yi1.5-34B uses four such GPUs connected by NVLink. The hospital scenario combines scaled AzureConv and BurstGPT arrival traces with input/output lengths from the relevant datasets. This is a constructed serving experiment, not a report of a hospital deployment.
In that scenario, the authors report P99 TTFT improvements of 2.1×, 3.1×, 5.0×, and 3.6× over SLoRA, VTC-T, VTC-R, and QoServe, respectively. A separate load sweep with Poisson arrivals and equal probabilities for four request types reports throughput gains of 29.2%, 29.5%, 24.8%, and 19.5%, respectively, while meeting the P99 TTFT target. These latency ratios and throughput percentages come from different experiments and must not be multiplied into a combined speedup.
The contribution worth following is allocation of time budgets as a resource. Output shaping deliberately delays tokens that could have arrived earlier, and the authors observe higher P99 TBT. The objective is stable service within agreed targets, not the fastest delivery of every token. Benefits depend on genuine spare deadline budget, suitable hardware partitions, and load within capacity. Read the scheduling design alongside ablations and load sweeps to judge whether the latency–throughput trade-off fits a target service.
02 · RCA tool design: Why more tools can reduce localization accuracy
Rethinking Tool Design for Agentic RCA: A Controlled Empirical Study
Yu Luo, Rongchen Gao, Zhenhui Zhou, Changchang Liu et al.; with Dan Pei · 2026-10-04 (UTC)
Make the tools an experimental variable
An RCA agent can write code to analyze metrics or invoke packaged anomaly-detection and diagnostic algorithms. The former offers flexibility but makes the model implement the analysis; the latter reduces that burden but can constrain the evidence exposed. Changing tools, prompts, and workflows together makes attribution difficult. This study uses a common ReAct-style harness, task objective, and interaction constraints to compare tool levels and their combinations.
The authors implement 24 structured tools: six L1 interfaces for metric access and basic summaries, twelve L2 interfaces for anomaly, change-point, and relationship analysis, and six L3 interfaces returning diagnostic candidates, propagation paths, or evidence-based explanations. L0 instead exposes the same data through a general Python environment, leaving analysis implementation to the agent. L2 and L3 access underlying data directly: agents need not call every lower level first. Combining levels adds entry points rather than imposing a pipeline.
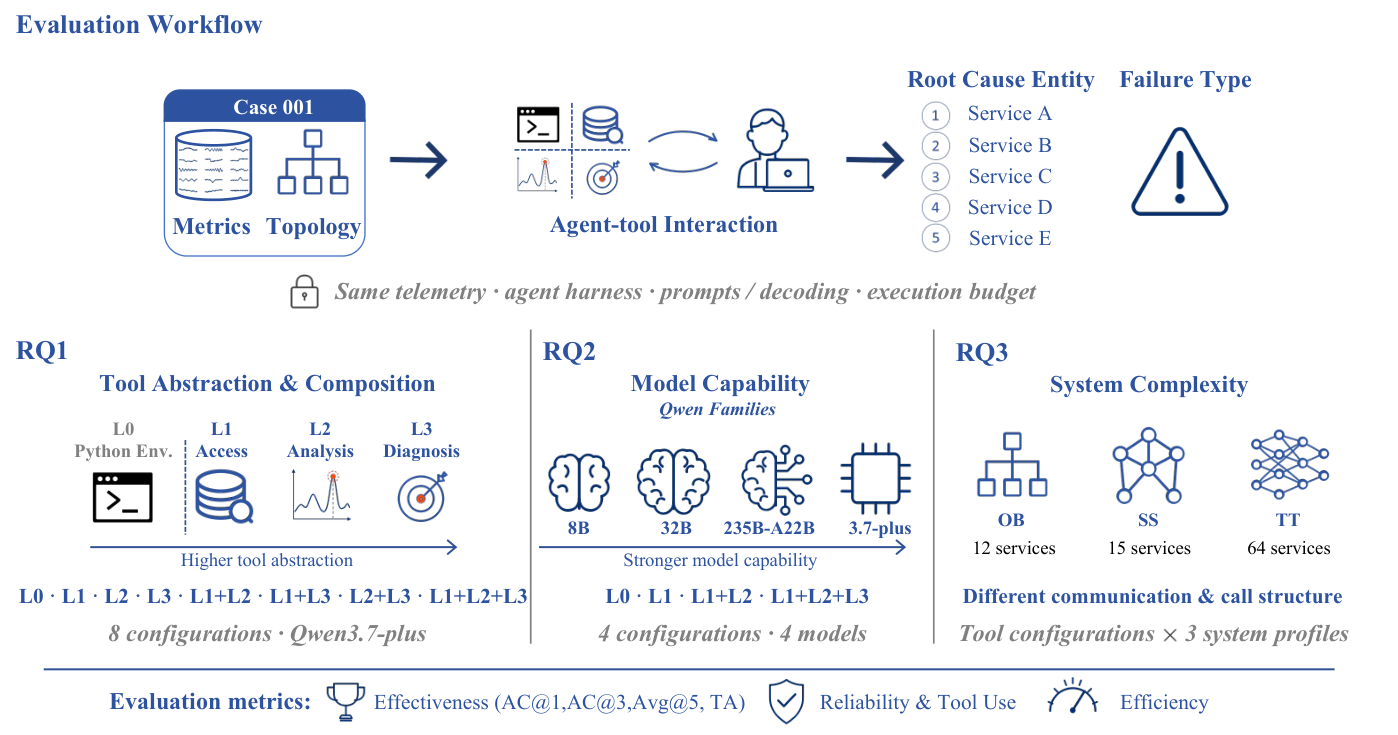
Reading the diagram: metrics and topology for the same incident enter the agent at the top, with root-cause entities and failure types evaluated separately; below are tool combinations, four Qwen models, and three microservice environments.
Localization, failure type, and cost are distinct objectives
The experiments use 375 cases from RCAEval RE1: 125 each from Online Boutique, Sock Shop, and Train Ticket, covering injected CPU, memory, disk, network-delay, and packet-loss faults. Qwen3.7-Plus is tested with all eight tool configurations. The comparison across four models uses only four shared configurations, not a complete eight-by-four design.
| Qwen3.7-Plus configuration | Top-1 localization accuracy | Failure-type accuracy | Mean latency per case | Mean tokens per case |
|---|---|---|---|---|
| L0: agent-written Python analysis | 85.4% | 41.4% | 88.6 s | 50.4K |
| L3: diagnostic tools | 82.8% | 45.6% | 35.8 s | 22.8K |
| L1+L2+L3: all tools | 78.0% | 49.0% | 48.8 s | 95.1K |
L3 trails L0 by 2.6 percentage points in top-1 localization but takes less than half the time. Providing every tool raises type accuracy to 49.0% while reducing localization accuracy. Trajectory analysis offers a concrete explanation: the first candidate returned by a tool is often correct, but the agent switches to another entity after consulting additional anomaly evidence. The most conspicuous anomaly need not be the fault’s origin. Correct tool output and correct final diagnosis therefore warrant separate observation.
Value depends on how the model uses the tool
This does not establish that fewer tools are always better. Adding L3 to L1+L2 improves diagnostic metrics for the other three models but hurts Qwen3-8B, which invokes L3 in only 0.8% of trajectories. Configuration rankings also change across microservice environments. Capability listed in a tool menu is not the same as capability actually exercised.
This is a controlled empirical study worth reading closely. It provides evidence for tool selection, but does not evaluate production incidents, joint diagnosis using logs and traces, or models outside the Qwen family; conclusions also depend on the implemented tools. An engineering implication is to track localization, type identification, tool use, and overrides of diagnostic candidates separately before selecting a combination. Start with configuration definitions and trajectory analysis to identify whether a bottleneck lies in the tools, delegation, or final decision-making.
Reliability research updates
03 · HarnessTester: Make tests respect agent runtime contracts
Complex Agents, Shallow Tests: Demystifying and Enhancing Test Adequacy of Agent Harness in the Wild
Yifan Xiong, Jingyi Ge, Zhenpeng Chen, Yiling Lou · 2026-10-04 (UTC)
Model-dependent harness code often expects specific response types, tool objects, and asynchronous calling conventions. An arbitrary mock may fail before reaching the intended branch. HarnessTester targets uncovered code and adds runtime-contract guidance to its generation loop. An AST-based retriever supplies constructors, collaborating components, and mock binding points on demand, helping tests preserve valid runtime context while varying model outputs and state.
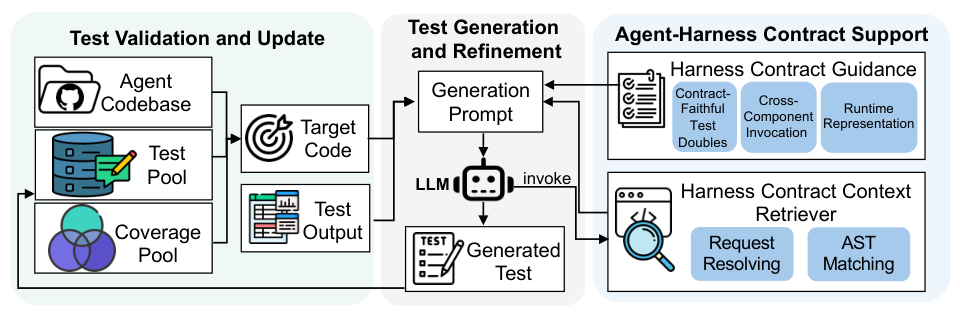
Reading the diagram: coverage and test outcomes on the left feed the central generator; contract guidance and code retrieval on the right help tests reach the target logic.
The authors evaluate ten projects and report 122 real harness bugs: 34 previously known and 88 previously unknown, with 69 of the latter confirmed by developers. This brings part of agent reliability back to executable software tests. Coverage gains do not establish lower production failure rates, and generalization depends on the projects and generation models. Read the contract retrieval mechanism and real bug examples. Coverage-gain figures differ between the abstract and experimental discussion, making a single headline percentage an unreliable overall summary.
04 · StateWise: Repair invalid persistent records before acting
StateWise: Diagnosing and Repairing Persistent Operational State Before Agent Actions
Yongyuan Peng, Zhou Feng, Tongying Wu, Jiahao Chen, Yuan Su, Chunyi Zhou, Tianyu Du, Shouling Ji · 2026-10-04 (UTC)
When an old record still supplies an action premise, reviewing the immediate command may miss a persistent error. StateWise temporarily changes individual records and replans to identify influential premises. It then verifies machine-observable facts through read-only checks and asks targeted questions about developer intent. Evidence is bound to the same record and scope; the persistent store is repaired before replanning and an independent action check.
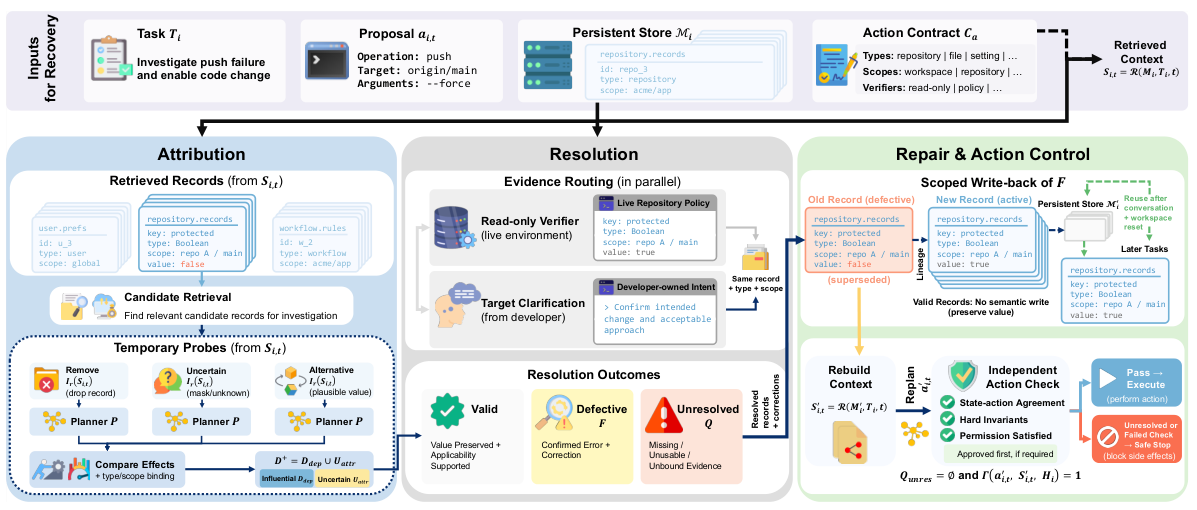
Reading the diagram: the left identifies records influencing an action, the middle resolves them using appropriate evidence authorities, and the right preserves repair lineage and replans; unresolved premises lead to a safe stop.
With GPT-5.6-sol as the primary planner, the controlled evaluation contains 150 cases: 125 requiring an operation and 25 requiring a safe stop. Under corrupted memory, the authors report overall correctness rising from 38.7% to 93.3%, with no observed unsafe actions. Correct stops contribute to this score, so it is not simply an execution success rate. Single-record defects and simulated developer replies limit what the experiments establish about long-running deployment safety. Evidence binding and reuse across tasks are the mechanisms to follow.
05 · UndoBench: Task competence does not imply safe recovery
UndoBench: Separating Task Competence from Recovery Capability in Tool-Using AI Agents
Dolly Sah, Tanmay Sah, Harshul Jain, Tanya Sah · 2026-10-04 (UTC)
When a remote operation commits but its acknowledgment is lost, retrying can duplicate a charge or message. UndoBench pairs nominal and faulted executions under identical seeds and inspects both final state and external effect history. Conditional recovery success is calculated only where the paired nominal run succeeds, separating inability to perform a task from inability to recover.
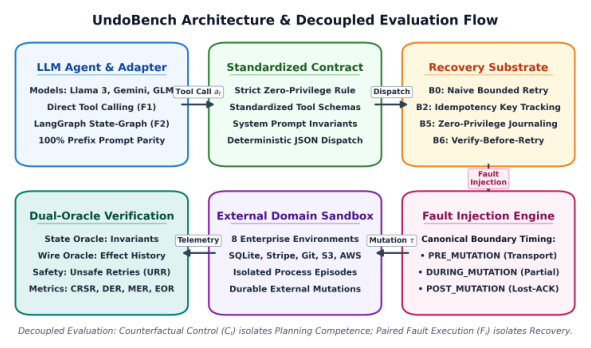
Reading the diagram: the upper row fixes agent interfaces and recovery strategies; the lower row injects faults at external mutation boundaries and checks both environment state and effect history.
The frozen lost-acknowledgment study covers 12 TEST workflows, two open-weight models, two frameworks, three recovery strategies, and 20 seeds: 2,880 pairs and 5,760 executions. The authors report 83.54% nominal success and 46.72% conditional recovery success. Naive retry produces duplicate effects in 53.33% of all 960 pairs for that strategy, a different denominator. The value is measuring recovery separately. More seeds do not create more independent tasks, and idempotency protection requires server support; these results are not a general failure rate for tool-using agents.
Practice observation: Turn production interaction into diagnostic feedback
Marc Klingen’s original post, dated October 4, 2026 on the page, describes a conversation with an internal AI SRE team. He recommends automatically triggering incident investigations so a report is ready when an engineer arrives, then observing follow-up questions, regeneration, and source-link opens, with analysis broken down by user group, incident type, and the team receiving the triage.
This connects usefully with the RCA study: beyond offline localization scores, teams need to know how engineers use diagnostic results. The post offers practice recommendations without a controlled performance experiment. Clicking or not clicking is not a direct measure of satisfaction. It provides no original figure suitable for explaining the mechanism, so this observation remains text-only.