An alert can involve a frontend, services, databases, and infrastructure, yet investigators often first need to answer simpler questions: do these components belong to the same business path, who maintains them, and what changed recently? Grafana’s Knowledge Graph update aims to organize these connections into queryable runtime context. Its interesting contribution is a shared starting point for people and agents, reducing the work of reconstructing a system from scattered telemetry for every investigation.
Original: Full-stack observability in Grafana Cloud: More connections, richer context, and faster investigations for users and agents
Sarah Constant · Grafana Labs · 2026-10-20
Establish entities, then connect signals
The Knowledge Graph overview treats services, pods, nodes, and databases as entities, with properties such as environment, version, and cluster. Opening an entity brings together its metrics, logs, traces, and health insights. Investigation can start by finding the affected object and examining its evidence instead of first inventing a query.
For agents, one way to understand the benefit is a smaller search space. Knowing the affected service and adjacent database reduces the need to traverse every dashboard for similarly named objects. This is an inference about workflow: richer relationships can guide queries, but do not establish correct root-cause judgments.
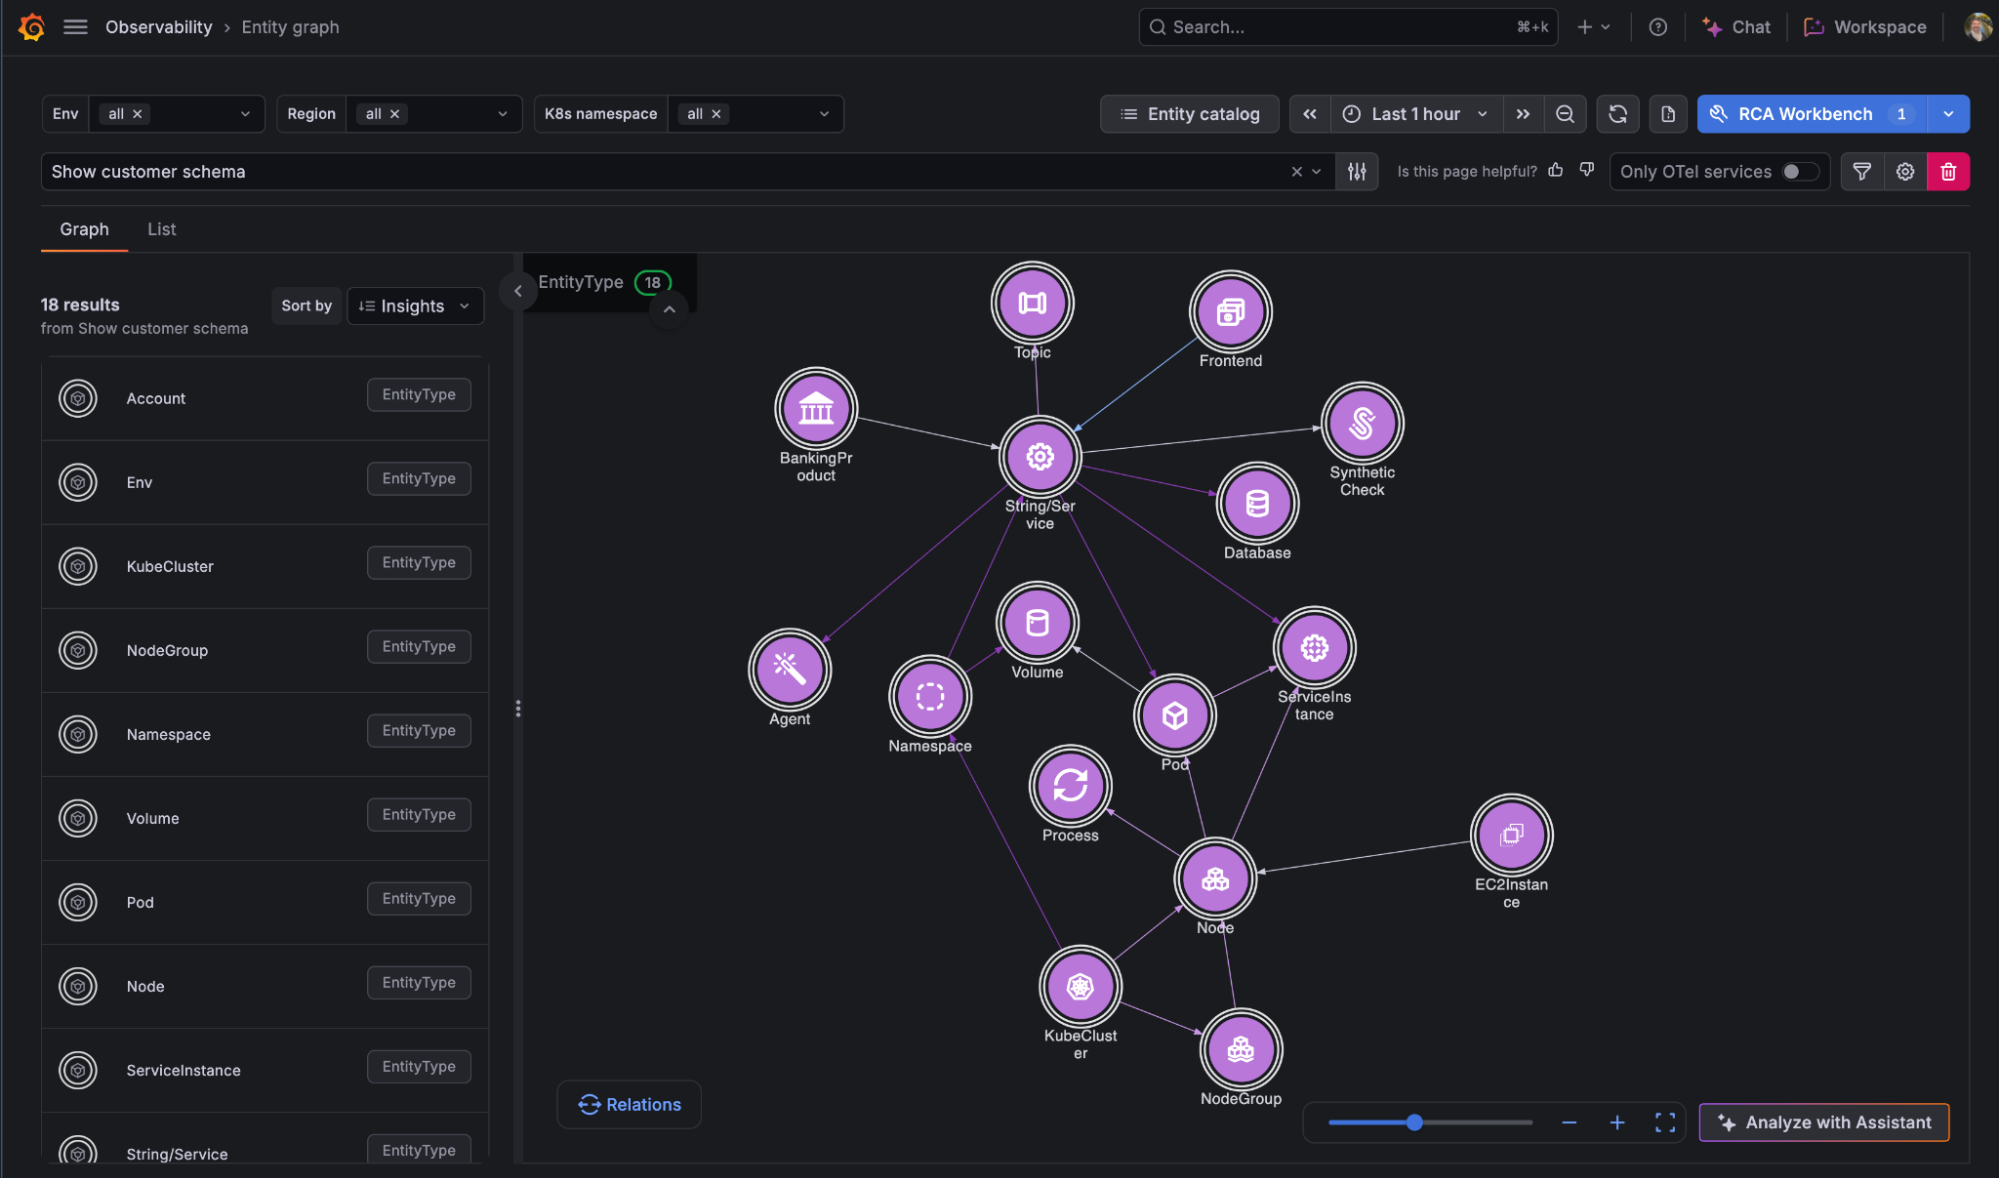
Start at the central service and follow connections to the frontend, database, and infrastructure below. This is an entity-type relationship view, not proof of fault causality.
How the graph is constructed
The entity and relationship configuration documentation explains a concrete mechanism: a builder queries Prometheus metrics and extracts entities and properties from labels and values. Relationships can come from matching properties or metric queries. Name and scope jointly identify an entity, so identical service names in different environments should not automatically merge.
Graph reliability therefore depends first on observation and modeling. A missing namespace label can create ambiguous identity. Encoding business ownership as a call relationship can confuse the meaning of an edge. Stale updates can leave retired resources as neighbors. These are engineering risks inferred from construction, not error rates measured in the announcement.
Custom entities let teams group components into products or business objects, but require maintainable rules. A reasonable adoption sequence is to check identities and relationships along one real business path before expanding coverage. A larger graph is not necessarily more useful. Poorly defined connections simply let an agent retrieve along an incorrect edge faster.
Insights prioritize; underlying signals explain
The insight-category documentation distinguishes saturation, configuration changes, anomalous patterns, component failures, and request errors. These categories describe implications for the system rather than merely whether evidence came from a metric or log. A configuration change can become a timeline clue to compare with the onset of errors or latency.
Correlation still needs to be distinguished from causality. A database slowing after deployment may reflect increased queries from new code, or an unrelated external dependency failure. A graph identifies neighboring components worth checking; a timeline suggests ordering. Queries, traces, or change evidence must support the eventual explanation. Treating every red node as an independent root cause would recreate an alert flood.
Bringing organizational knowledge into investigation
The announcement extends context to service ownership, on-call information, and actions and outcomes from past incidents. The associated Service Center and IRM integrations remain in private preview. Capturing what was tried and what happened can provide more useful hypotheses than attaching only an incident summary, but does not guarantee that an earlier remedy remains valid. Official announcement
Consider an engineering example: a restart once restored connections briefly before errors returned. A record saying only that the restart worked could encourage an agent to repeat an ineffective action. Preserving the recovery duration and subsequent observations could instead lead it to investigate a connection leak. Conditions and outcomes matter more than turning historical actions into permanent rules.
The Assistant Knowledge Graph mode documentation focuses on modeling, missing connections, and rule configuration, distinguishing that work from incident investigation. It can propose configuration changes, but complete rules and diffs still need review. Generating a relationship rule and establishing an incident’s root cause are different capabilities.
Shared context needs shared time boundaries
Runtime relationships change with scaling, releases, and routing rules. A graph from a historical incident may differ from the current graph an investigator sees. An agent querying a dependency should know its environment and observation period, or it may interpret today’s topology as yesterday’s incident topology. This is an engineering requirement to ask of runtime context, not a complete historical-reconstruction capability established by the announcement.
A missing edge also has several possible explanations: components did not interact, telemetry missed the interaction, naming rules failed to match, or the product does not support that connection. Investigation should preserve these alternatives rather than equating absence from the graph with absence from the system. This uncertainty matters especially when an agent automatically chooses the next query.
Two kinds of checks can assess graph value: can known relationships be recovered, and are nonexistent relationships incorrectly connected? Both coverage and false connections matter. Only then do additional entities meaningfully narrow the search space instead of creating a more complicated starting point.
Repeat these checks after renaming, migration, and scaling; correct initial configuration does not make relationships permanently correct.
Availability and evidence boundaries
General availability of the Agent Observability product does not mean every agent-to-graph connection is generally available. The launch article labels agent graph integration public preview, while the current overview labels it private preview. Treat that connection as a preview capability and verify access for the intended tenant. Frontend and expanded cloud-resource connections should also be distinguished from preview integrations for service catalogs and incident memory.
The article supports an improved investigative experience through product descriptions and customer accounts, without a controlled comparison of root-cause accuracy or MTTR. The transferable idea is to treat diagnostic context as a systems-engineering responsibility: check entity coverage, relationship correctness, and the freshness of historical knowledge, then observe whether investigations take fewer wrong turns. For AIOps, this moves agent inputs toward structured runtime evidence. Its quality remains bounded by the evidence represented in the graph.