In this issue
An inference request can cross the serving engine, CUDA, and GPU communication, while training produces large volumes of collective-operation records. TELLER reconstructs request-level evidence for diagnosis; NIXT makes communication measurements queryable by time, location, and configuration. Their problems differ: one studies inference fault attribution and the other training communication performance, so their results are not directly comparable.
01 · TELLER: combining cross-layer traces and logs into diagnostic evidence
TELLER: Non-intrusive Cross-Layer Root-Cause Analysis for LLM Inference
Ruilin Xu, Junyi Li, Pengfei Chen, Zongxuan Xie · 2026-08-03 · ASE 2026
Logs alone may not show what ran on the GPU, while raw profiler timelines lack request semantics. TELLER joins the engine, front and back ends, CUDA calls, kernels, and cross-node communication so a diagnostic model can inspect structure and text associated with the same request.
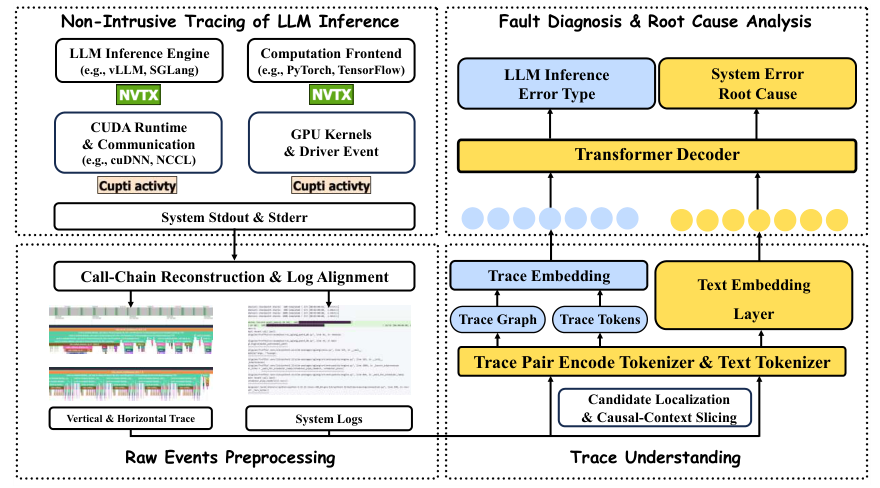
Reading the diagram: the left collects and aligns request traces and logs; the right extracts suspicious context, jointly encodes traces and text, and predicts a fault type and explanation.
The system uses NVTX and CUPTI signals to reconstruct request call chains and aligns logs by request ID or time window. Numeric localization identifies candidate anomalies; a context slice preserves parent–child, temporal, and communication relations around them. Trace Pair Encoding (TPE) compresses traces into structural tokens with parent, depth, and duration attributes. A decoder combines these with logs to predict abnormal steps and suspicious operators and generate an explanation. This narrows investigation; it does not automatically prove causality.
The authors collected 300 request traces across SGLang, Torch FSDP, and vLLM settings, containing 2,482 execution steps; faults were mainly controlled injections. With a 256-token vocabulary, TPE reduced the mean events per step from 2,241.92 to 361.43, an 83.88% reduction. More aggressive compression shortened sequences further but degraded diagnosis. Combining traces and logs yielded fault-type macro F1 of 0.476, compared with 0.292 and 0.446 for the single-modality variants.
The boundaries matter. Splits are request-disjoint, but correlated traces from the same workload or injection campaign can cross splits, making these primarily in-distribution results. The main experiment used a dual-node A40 setup. In one overhead measurement, runtime rose from 64.77 to 71.15 seconds (9.8%): non-intrusive does not mean free. A real vLLM case illustrates why cross-layer evidence helps: engine metadata indicated a new request while the backend selected decode and the device ran a decode kernel. That illustration should be distinguished from aggregate accuracy on the injection benchmark.
02 · NIXT: making collective communication metrics queryable
NIXT: A NCCL Inspector Exporter Tool for Observability of Collective Communication in Large Model Training
Ziyang Jia, Sirshak Das, Jason Sewall, Laxmi Bhuyan, Pasha Shamis, Daniel Wong · 2026-08-02
NCCL Inspector continuously reports collective statistics, but voluminous per-rank records make it hard to identify the communicator, host, or message size behind a variation. NIXT builds on Inspector and its existing Prometheus interface with an analysis-oriented taxonomy, structured storage, and reusable queries. It neither replaces NCCL nor proposes a new communication protocol.
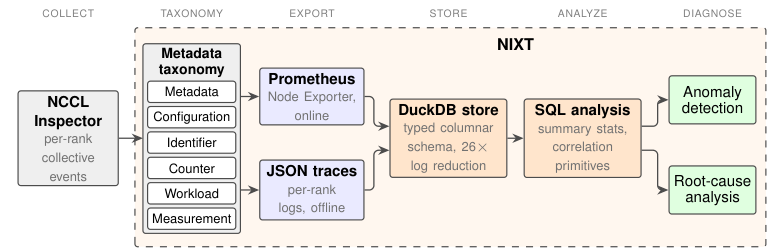
Reading the diagram: Inspector records enter columnar storage through online or offline paths; queries by configuration, time, and location support anomaly investigation and root-cause analysis.
NIXT separates communicator configuration, rank and host identifiers, counters, workload properties, and bandwidth measurements, and derives interconnect categories from the records. SQL analysis can compare message sizes and topologies or expose spatial and temporal variations hidden by averages. It describes both offline JSON and online Prometheus inputs; the reported DuckDB ingestion and query costs are for post-hoc analysis, not the full cost of continuous online operation.
The authors examine Nemotron-4 15B and 340B training on an H100 cluster, from 16 to 2,048 GPUs. For the largest 340B trace, 17.7 GB of raw JSON became a 0.67 GB store; ingestion took 56 seconds and each analysis primitive ran in under 0.3 seconds. Inspector itself added under 2% end-to-end overhead in the measured training workloads. For 15B, AllGather volume grew with data parallelism; at a fixed 2,048 GPUs, 340B exercised a richer communication mix with more traffic crossing nodes. These are observations for the studied models and cluster, not proof of automatic diagnosis for arbitrary faults.