What matters in this issue
Start with two studies that move observation inside failures. IntAct asks whether a correct tool call remains the same action after passing through wrappers, shells, and process interfaces. PonyTail asks whether a slow request executes different code, repeats more work, or encounters a different hardware bottleneck. They supply evidence that ordinary call trajectories and aggregate hotspot profiles can miss.
Both narrow the unit of diagnosis. IntAct uses receiver-side parsing to locate the first semantic divergence and select a transport representation. PonyTail attributes control flow and hardware events to individual requests to help engineers design optimizations. Their boundaries are equally useful: faithful execution does not establish that the user’s goal is correct, and a slow-request signature does not automatically establish its cause. Read IntAct first for agent tool reliability, or PonyTail for service performance analysis.
01 · IntAct: check whether the execution path changed the tool call
Do Tool Calls Execute as Intended? Measuring and Repairing Intent-Execution Correspondence in LLM Agents
Boyang Yang, Zhenhao Li, Ziyao Yang, Kanghui Jia, Xin Yin, Mingmou Liu, Haoye Tian · First submitted 2026-10-03
A correct call can execute a different action
A tool call typically passes through serialization, a host wrapper, shell parsing, a process interface, and the target parser. Consumed quotes, collapsed backslashes, or truncated text can change the arguments that the program receives. Looking only at the emitted text and final result can misattribute the failure to the model; retries may then corrupt a call that was originally correct.
The paper defines intent-execution correspondence (IEC) as agreement between the executed action and what the emitted call denotes under the tool contract. Intent here is not the user’s ultimate goal: an incorrectly generated command remains a generation error. Compared with checking one wrapper or asking a model to explain a failed trajectory, the contribution is observation at each hop with comparison under the receiver’s semantics.
Locate the first divergence, then choose the channel
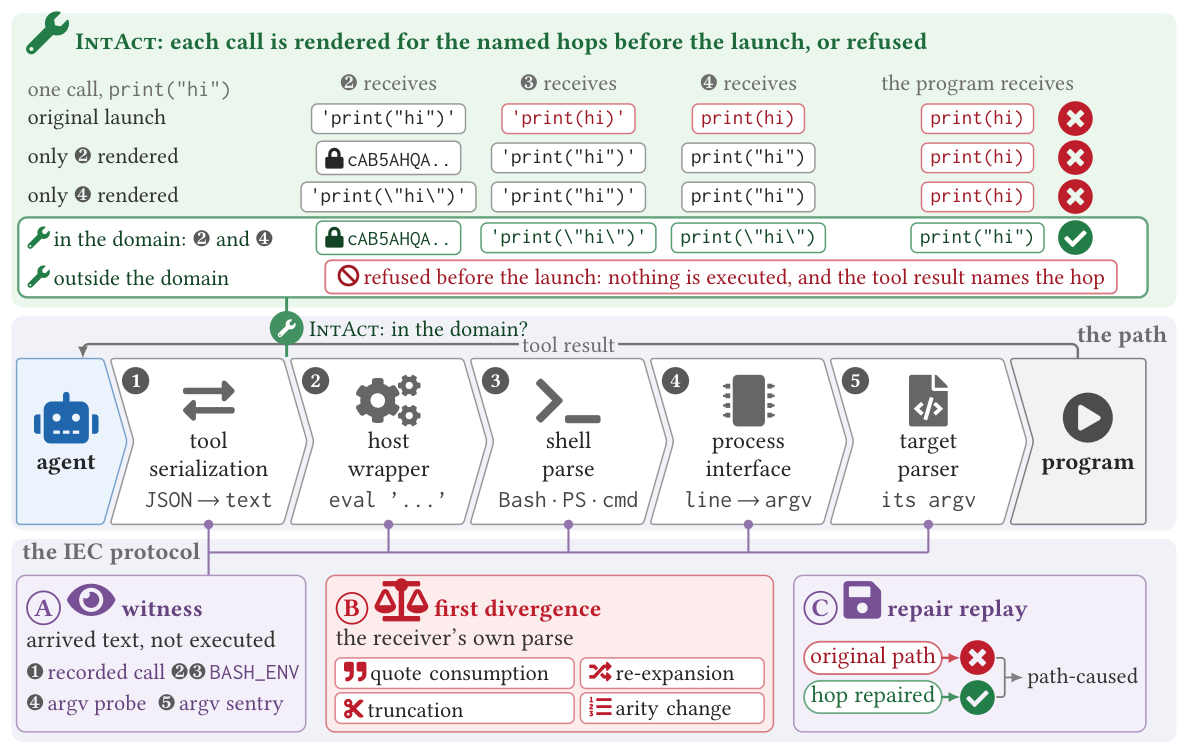
Reading the diagram: the middle shows five execution hops; below are witnesses, first-divergence localization, and repair replay for attribution. The top shows why fixing one hop can still fail, requiring combined repairs or refusal to preserve the call’s meaning.
An IEC witness preserves the launch path but replaces the target with a probe that reports received text or arguments without executing the original command. Receiver-side parsers compare actions, avoiding the assumption that different strings imply different semantics. Controlled repair replay then keeps recorded actions fixed, changes only the identified transport boundary, and checks whether the failure disappears.
IntAct takes the identified path, problematic hops, and call text, returning a suitable representation or an explicit refusal. A Bash wrapper can carry the command through a file. A PowerShell path may require rendering native arguments first, then encoding the script to bypass reparsing by the wrapper. If two hops change the call, repairing only one is insufficient. Unsupported cases are refused; adding more quotes is not a general guarantee.
Read the denominators with the numbers
The Windows production corpus contains 47,828 shell calls from 261 sessions by six developers. Of 7,491 Claude Code Bash calls exposed to particular text hazards, 12.0% changed; this is not a failure rate over all calls. Among 663 executed calls with changed backslashes, 535 reported no error, or 80.7%.
IEC-Bench covers 67 pattern pairs, 135 dependent call chains, and 46 cross-platform tasks. Replaying fixed recorded actions, IntAct recovered 137 of 173 lost pairs with a changed call, or 79.2%. It recovered none of the separate 187 lost pairs without a changed call. Across the table’s model-in-the-loop conditions, tokens per passed task on the original path were 2.4 times those with IntAct; that is not an equivalent reduction in total monetary cost.
Reading judgment: a useful study of execution contracts to examine closely. Released integration forms add 2.1–396 ms per call, depending on the integration; quoting only the fastest value would conceal this variation. The method depends on the shell, launch configuration, and supported syntax. It does not establish correct tool selection or fulfillment of the user’s goal. Prioritize the correspondence definition, hop-specific repair, and fixed-action controls. The authors’ implementation provides a follow-up resource; it was not installed or run here.
02 · PonyTail: trace slow requests back to code and hardware
PonyTail: Profiling and Improving Service Tail Latency
Roee Wodislawski, Adam Morrison · First submitted 2026-10-03
Beyond scheduling, optimize the slow requests themselves
Response time includes both queuing and actual service time. As scheduling approaches an appropriate policy for the distribution, further tail-latency improvement requires understanding why requests themselves are slow. Conventional hotspot analysis ranks aggregate execution time, allowing rare tail behavior to disappear into the overall profile. PonyTail instead groups requests and compares the code and hardware footprints of slow and typical requests.
It distinguishes three cases: different static code; the same code with different dynamic behavior, such as more loop iterations; and similar code behavior with different microarchitectural bottlenecks. It is a methodology and toolkit for manual analysis, not an automatic repair system or an alternative scheduling policy.
Attribute low-level events to requests
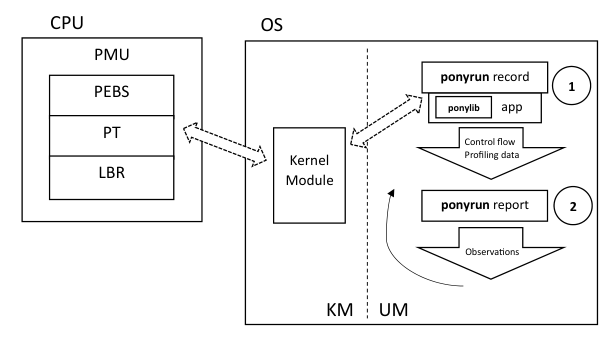
Reading the diagram: CPU tracing and sampling data on the left pass through the kernel to the recording tool. Ponylib in the application marks request boundaries. The reporting tool below turns the collected data into observations for analysis.
Applications use ponylib to mark request start and completion, along with suspension and resumption caused by service-level scheduling. Built on Linux perf, ponyrun collects Intel PT control flow, PEBS event samples, or performance counters, then separates data by request activity intervals. Outputs include dynamic-basic-block heatmaps ordered by service time, pipeline-utilization breakdowns, and correlations between block execution counts or time and request duration.
Engineers first look for distinctive groups among slow requests, then profile only the relevant group. If the issue is more iterations of the same loop, they investigate its relationship with the input. Correlation guides investigation; source inspection and measurement after a change are still needed to test the explanation.
The cases reveal different optimization opportunities
The authors analyze five TailBench services on an Intel Xeon Gold 6442Y. Experiments use one worker, an FCFS queue, and an integrated client/server configuration, with dynamic frequency scaling and hyper-threading disabled and the service pinned to a core. Reported times average three runs.
Silo’s extreme outliers expose periodic memory reclamation. Increasing reclamation frequency fivefold reduces the backlog handled each time. At 32% load, maximum service time improves 4.3 times, but p99 improves only 1%. Fixing the far tail need not substantially move p99, so the percentile condition matters.
In Xapian, locating documents inside a chunk costs more than locating the chunk itself. Reducing database chunks from 2 KB to 1 KB cuts mean and tail service times by approximately 30%. Combined with a microarchitectural optimization, the full solution improves mean and p99 response time 5.3 times and 4.6 times, respectively, at 87% load and 1,200 RPS. The larger response-time benefit includes queuing effects; it is not a corresponding computational speedup for each query.
Diagnosis has collection and analysis costs
Across three evaluated services, tracing and sampling increase mean service time by geometric averages of 16.5% and 13.7%, respectively; sampling occurs every 100 K cycles. Offline trace analysis takes approximately 4.5–6 minutes per second of single-core service execution, with peak virtual memory reaching hundreds of GB. The prototype targets C/C++ and does not support JIT or self-modifying code. It is unsuitable for always-on deployment.
Reading judgment: a performance-diagnosis method supported by concrete cases. Start with request grouping and the case studies, then examine collection costs. Its practical contribution is explaining tail behavior, not promising a universal optimization. Keep the earlier ideal-server simulations separate from the subsequent measured cases: simulation establishes potential, while cases test particular changes under particular loads.
A related observation: combine outcome metrics with execution evidence
Camila’s (@AiCamila_) original post was published at 16:12 UTC on October 2, 2026, or 00:12 on October 3 in Beijing. It recommends observing six groups together: outcomes, latency, cost, reliability, quality, and saturation. This is a practical checklist without a controlled experiment.
Read alongside the papers, it provides a useful starting point for a dashboard: metrics indicate whether outcomes improve, while hop-level evidence and request-level analysis help explain why. These forms of evidence complement one another, but the post does not validate either IntAct or PonyTail. This section remains a text summary; a social graphic would not substitute for methodological evidence.