What matters in this issue
How much work sharing saves depends on how well a system handles its boundaries. Two featured papers ask what makes CPU–GPU data visible and avoids movement once physical memory is shared, and why tokenization can still stall requests after long contexts hit the KV cache. The first studies cache policy, hardware coherence, and synchronization contention together; the second moves optimization upstream of the inference engine to the serving frontend.
Start with the UMA memory-sharing study and GraphTok. Both explain how removing a major expense exposes a previously secondary bottleneck. Three further papers examine state management: SnapShare limits which snapshot content may be shared, ShoreKeeper places cached data according to recovery cost, and BLIS simulates serving workflows to screen configurations. Updates on an Azure SRE Agent vulnerability and an observability tool guide connect performance with operational reliability.
01 · UMA: shared physical memory still needs a visibility design
Characterizing CPU-GPU Memory Sharing over Unified Memory Architecture
Jinrong Yang, Zimeng Wang, Rong Chen, Haibo Chen · First published: 2026-10-09 · EuroSys 2027 (acceptance stated by the source)
Zero-copy addresses only part of the problem
Unified memory architecture lets CPUs and GPUs access the same physical memory, but it does not automatically synchronize their private caches. Programming as if device memory were separate leaves redundant copies; simply exchanging pointers can expose stale data. The paper’s contribution is to analyze correctness and performance together, giving applications a conditional basis for choosing implementations.
The authors study Raptor, Arrow, Lunar, and Orin, comparing interconnects, memory-side caches, and one-way coherence, then extend the study to two-way coherence on DGX Spark. They separate communication into sending and receiving stages, configure binding, reads or writes, and unbinding independently, and combine page sizes, cache policies, and coherence settings. Tests check deterministic payloads word by word. This establishes empirical visibility evidence for the configurations tested, rather than a formal guarantee for every concurrent memory interaction.
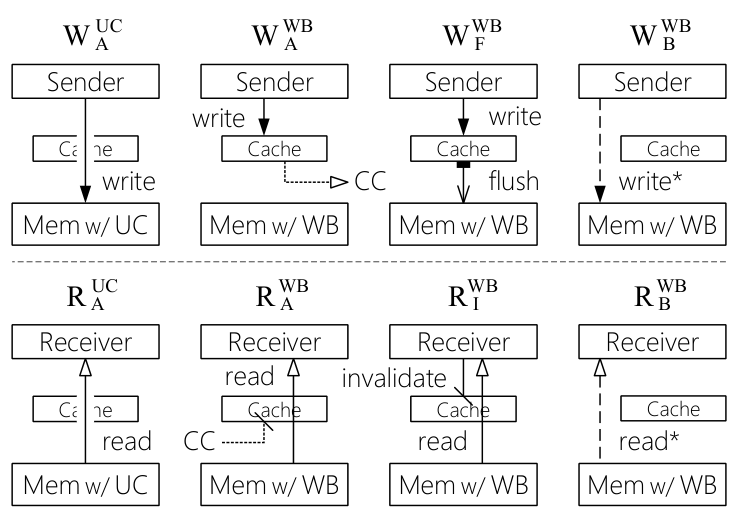
Reading the diagram: the upper row controls how writes leave the sender’s cache; the lower row controls how the receiver obtains fresh values. Flushing, invalidation, bypass, and hardware coherence form different combinations that must match memory attributes.
Bulk data and small synchronization flags need different policies
For the data plane, mapping setup matters alongside movement. Small 4 KB pages can make page-table configuration expensive for large regions, while forcing small regions into 2 MB pages wastes space. The authors recommend transparent huge pages with prefaulting. Disabling caching simplifies visibility but can severely slow CPU access. Hardware coherence also has a price: on Arrow, which lacks a memory-side cache, GPU writes with coherence take 2.07 times as long as without it.
The control plane may exchange only a flag. When thousands of GPU threads poll it, contention can outweigh individual access latency. The paper compares block-level, grid-level, and separate-kernel coordination, emphasizing fewer threads touching the shared flag. Grid-wide synchronization additionally requires care to avoid deadlock.
libumsh packages these choices behind common interfaces. Applications specify transfer direction, whether data originates from I/O, and whether communication crosses kernel boundaries or happens inside a kernel. The backend selects reads, writes, coherence, and cache maintenance. Platform differences remain: Arrow and Lunar require runtime changes to expose some controls.
What the results establish
Across nine application case studies, the authors measure 16–75% less data-transfer time and 7–90% less coordination overhead. These are improvements to the relevant stages, not equivalent reductions in whole-task latency. On Arrow, removing copies reduces PyTorch model-loading time by 75%, with transparent huge pages providing an additional improvement. Mapping overhead therefore affects the outcome too.
The agent-serving estimate is closer to user waiting time. TaskBench traces involve a GLM-4.7-Flash orchestrator and three tools executed sequentially, with warm runtimes but models reloaded on demand. Adding separately measured mean times gives an estimated 9.0–15.9% reduction in request latency. Workloads that reload models frequently are therefore especially relevant; these figures should not be transferred directly to services with permanently resident models.
Reading judgment: prioritize the read/write combinations and case-study breakdowns. The work offers an actionable way to optimize UMA applications, but fragmentation can force transparent huge pages to fall back, and driver controls differ. A new platform needs its own visibility and cost validation rather than configuration reuse based only on a unified-memory label.
02 · GraphTok: moving tokenization out of the frontend bottleneck after KV hits
Taking Tokenization off the Host for Agentic LLM Serving
Mohammad Siavashi, Pascal Schwinte, Ali Banaei, Gerald Q. Maguire Jr., Marco Chiesa, Dejan Kostić · First published: 2026-10-09
Repeated context must still become tokens
Multi-turn agents repeatedly send long histories. Prefix caching avoids repeated model prefill, but the server usually has to tokenize the request before looking up the cache. As GPU computation shrinks, CPU tokenization occupies more of time to first token. A frontend serving an entire GPU fleet may also exhaust its CPU capacity first.
GraphTok organizes pre-tokenization, BPE merging, and token-ID assembly into a replayable CUDA graph while requiring the same ordered ID sequence as the reference tokenizer. Accelerating merges while ignoring special tokens or regex boundaries changes model inputs. Matching decoded text alone is also insufficient to establish equivalence.
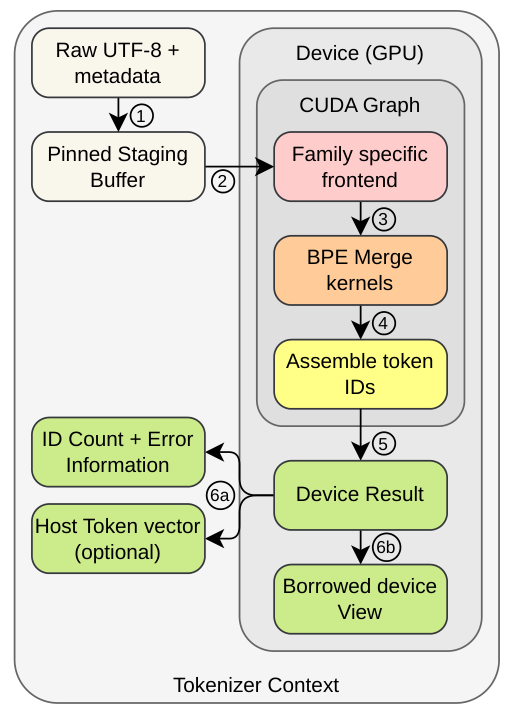
Reading the diagram: raw bytes enter the GPU through pinned staging memory. A family-specific frontend produces symbols and boundaries, the shared BPE backend merges them, and ordered ID assembly feeds either a host or device return path.
Parallelism without changing semantics
Pre-tokenization replaces sequential regex matching with position-wise boundary predicates and scans that supply context. For example, Llama 3 groups digits in threes from the start of a digit run; arbitrary equal-sized text chunks would not preserve that rule. Each family needs its own frontend, which is part of the engineering cost of supporting another tokenizer.
BPE runs in parallel across pre-tokens while preserving merge priority and positional tie-breaking within each one. Length-based routing assigns short pre-tokens to warp-cooperative merge selection and longer ones to separate paths. Dynamic counts and output compaction stay inside the graph where possible to avoid host round trips. Qwen’s NFC Unicode normalization still has a host step, however, and request policies such as truncation remain outside the graph.
Short inputs may not justify GPU transfer. GraphTok selects a CPU path according to cost, and its dispatcher batches concurrent requests for graph execution. The central contribution is covering the long-input encoding pipeline, not assuming every text and load should use the GPU.
Request latency and frontend capacity are different evidence
Experiments use one H100 NVL with two Xeon Gold 6336Y processors and 96 hardware threads. With vLLM 0.27.0, 32k–128k-token prompts, and 99% prefix reuse, the authors report 2.1–2.4× better mean TTFT than the stock tokenizer. Each cell has only five requests, and the gain also includes extra work in the stock frontend that decodes the entire prompt on the first step. gigatoken and TokTier are within 4% of GraphTok in this experiment, so the full improvement cannot be attributed to GPU tokenization. Complete tokenization calls include transfers.
The more striking capacity experiment uses a Dynamo frontend and simulated inference backends. With 121k-token requests and a P99 target of at most 2 seconds, GraphTok sustains 518 requests/s, versus 296 for gigatoken and 18.5 for the default tokenizer. The “traffic of 56 GPUs” interpretation divides that load by 9.25 requests/s per simulated GPU; the real H100 performs tokenization. This measures frontend supply capacity, not real multi-GPU serving TTFT.
The comparison also disables Dynamo’s prefix tokenizer cache and empties gigatoken’s pre-token cache before every request. Gains could shrink when cached history can be skipped directly. The method covers five concrete tokenizer configurations, and all hardware experiments use the same H100.
Reading judgment: follow this work for long-context serving frontends. Prioritize exactness, CPU/GPU routing, and the frontend experiment conditions. It identifies a bottleneck exposed by KV caching while leaving saturated real multi-GPU services, more hardware, and alternative cache combinations to be evaluated.
State management and capacity planning
03 · SnapShare: sharing only approved snapshot content
SnapShare: Isolation-Preserving Deduplication for Serverless Snapshots
Leonid Kondrashov, Likun Zhang, André Filipe do Pilar de Jesus, Hans Pistor, Marco Cali, Riccardo Mancini, Rodrigo Bruno, Dmitrii Ustiugov · First published: 2026-10-09
Serverless snapshots duplicate infrastructure, but unrestricted cross-tenant deduplication can reveal whether content exists. SnapShare matches pages against provider-approved references, shares only approved content, and retains tenant boundaries even for identical private pages. Separately, access profiling determines coalesced working-set prefetching versus on-demand 4 KB retrieval.
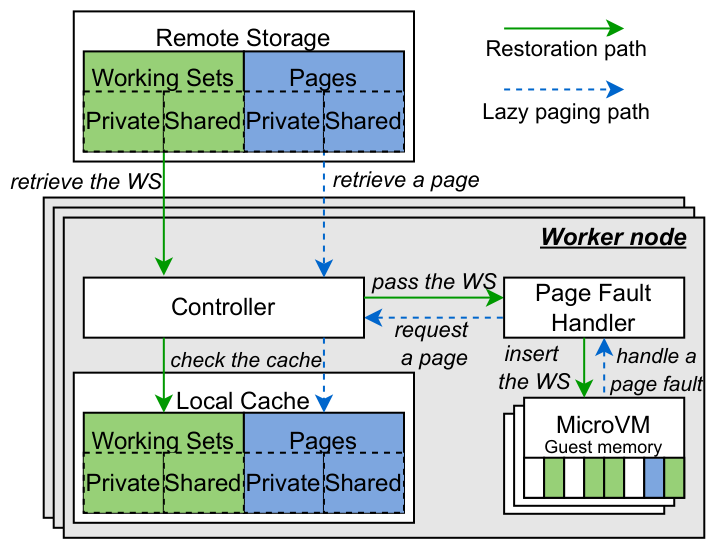
Reading the diagram: remote and local storage distinguish shared/private content and working sets/individual pages. Green paths restore working sets; blue paths serve subsequent page faults.
On 10 CloudLab nodes with 4 GB of cache per worker and snapshot downloads capped at 10 Gbps and 17 functions mapped to 700 invocation profiles, the authors report 10–29% lower tail request slowdown relative to chunk-based and working-set baselines. The contribution is separate control of sharing eligibility and retrieval granularity. Its boundaries are concrete: provider approval must be trustworthy, and secret-dependent accesses to approved components are outside its protection. The prototype uses equal MD5 digests as its match criterion; this does not establish comprehensive protection against adversarial collisions.
04 · ShoreKeeper: placing cached data according to recovery cost
ShoreKeeper: Accelerating Iterative Data Analytics in the Cloud via Distributed Recovery-Cost-Aware Caching
Jongseop Lee, Minsu Sun, Xinyue Ma, Atul Sandur, Myeongjae Jeon · First published: 2026-10-09
Cache eviction in iterative analytics triggers recomputation along dependency graphs, so locally optimal decisions need not benefit the cluster. ShoreKeeper estimates recovery costs through offline and online profiling, jointly chooses retention, placement, and replicas using mixed-integer programming, and prunes graphs to accelerate replanning. Preemption notices trigger migration of the most expensive data first.
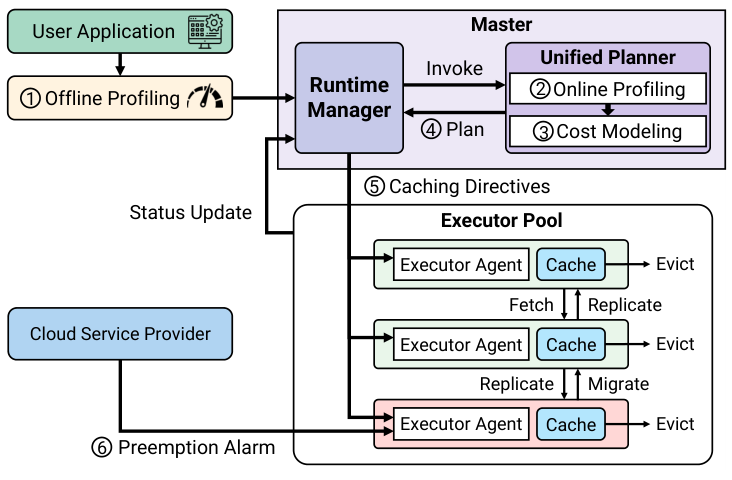
Reading the diagram: executors report state to a central planner. Cloud preemption alarms trigger replanning, followed by migration, replication, or eviction directives.
The default setup uses 11 AWS r5n.2xlarge instances, with ten workers hosting 20 executors. Replaying two Spot preemption windows gives 1.14–2.87× speedups over Blaze augmented with decommissioning migration. The method suits iterative dataflows with explicit dependencies and recomputable partitions. Short jobs may not amortize profiling; losing an entirely preemptible cluster still requires recomputation from input. In-memory replicas are not durable checkpoints.
05 · BLIS: including queues and caches in inference planning
Simulate Before You Scale: High-Fidelity LLM Inference Planning Without GPUs
Dipanwita Guhathakurta, Mert Toslali, Srinivasan Parthasarathy, Jing Chen, Michael Kalantar, Nicholas A. Masluk, Vishakha Ramani, Asser Tantawi, Fabio Oliveira · First published: 2026-10-09 · ACM SIGMETRICS 2027 (acceptance stated by the source)
BLIS predicts step latency using analytical terms and coefficients fitted globally once, then connects admission, routing, batching, KV management, and preemption through discrete-event simulation. Configuration search runs on a CPU, but its coefficients still depend on real-system measurements; it does not eliminate the need for GPU evidence.
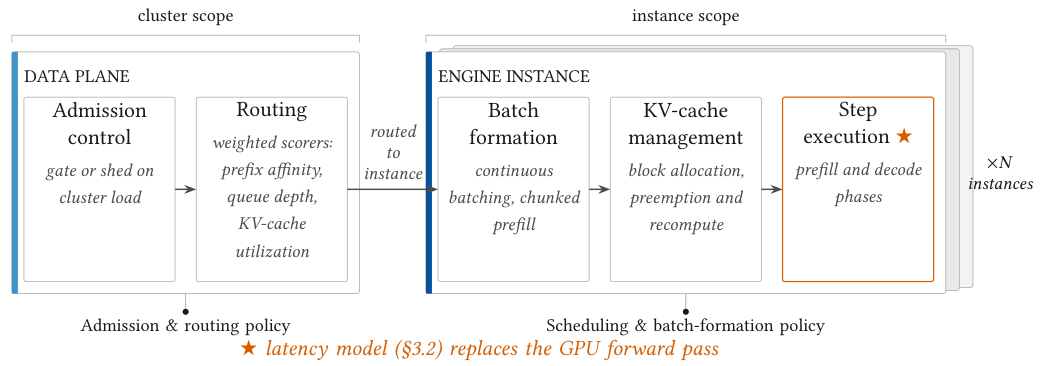
Reading the diagram: admission and routing on the left shape instance load. Batching and KV management remain on the right, while the starred step substitutes a latency model for the GPU forward pass.
Across 36 experiments with six models and three NVIDIA GPU types, median error in predicting mean end-to-end latency is 6.7%, with simulation approximately 200× faster than real execution. Median error for mean TTFT is 17.6%, so the lower number does not apply to every metric. Cross-node topology, contention, and expert parallelism remain incomplete, and absolute-error validation mainly concerns single instances. BLIS is useful for narrowing candidates before checking actual deployment SLOs.
Operational reliability updates
Authorization boundaries in Azure SRE Agent. The @UpwindMDR post, dated 2026-10-09, highlights CVE-2026-69435. Microsoft’s advisory and its CNA record describe missing authorization allowing an authenticated attacker to elevate privileges over a network. The record classifies it as SSRF, gives a public date of 2026-10-08, and identifies a hosted service. This highlights the need for explicit permission boundaries on operations agents’ tool requests; the public record does not establish a complete exploit chain.
Observability should cover the execution path. Maryam Miradi’s original post, displayed as 2026-10-09, groups tools into tracing, OpenTelemetry integration, logs and metrics, cost and performance, and production debugging. It helps organize what to observe. Its advertised 20 entries repeat Langtrace and OpenLIT, so they are not 20 distinct projects. The author describes comparison benchmarks as future work: this is a navigation guide, not a performance ranking or maturity evaluation.