Agent telemetry costs often come from duplicated content and high-cardinality dimensions. This CNCF tutorial works backward from six operational questions, comparing raw and optimized pipelines on identical input. Its useful contribution is to treat log bytes, metric series, and trace structure separately, then verify that the original queries still work.
Original: Filtering and reducing AI agent telemetry with the OpenTelemetry Collector
Adnan Rahic, Bindplane by Dynatrace · CNCF · 2026-10-22
Start with the questions
A Claude Code task fixing two tests and adding boundary tests produced 181 telemetry records and 289 KB of JSON with all content flags enabled. The author’s questions concern cost by model, session tokens and caching, tool failures, rejected edits, latency, and API errors. Counters and short attributes answer much of this without full files or diffs.
Volume and cardinality differ. Read output may put a whole file in a span event, while Write arguments duplicate content in logs. Metrics carry session, user, and account attributes, creating new series per session. Twenty-five sessions produced 300 series across eight metrics. Useful single-run debugging detail can become a growing fleet-level indexing cost.
This scope matters: prompt-injection review or explaining a code change may require the very content being removed. The tutorial reduces costs for its stated operational queries. Lack of a dashboard consumer does not establish lack of audit value.
Compare two paths from one receiver
One OTLP receiver fans logs, metrics, and traces into raw and optimized pipelines, with six exporters reaching the same Grafana LGTM instance. The control path adds service.name and batching; the optimized path adds processors. Shared input reduces differences caused by separate agent runs.
The tutorial uses Collector contrib 0.161.0 and LGTM 0.33.1. Duplication supports validation; retaining both streams in the same production backend would not realize the full savings. Raw retention should follow investigation needs and the eventual data lifecycle.
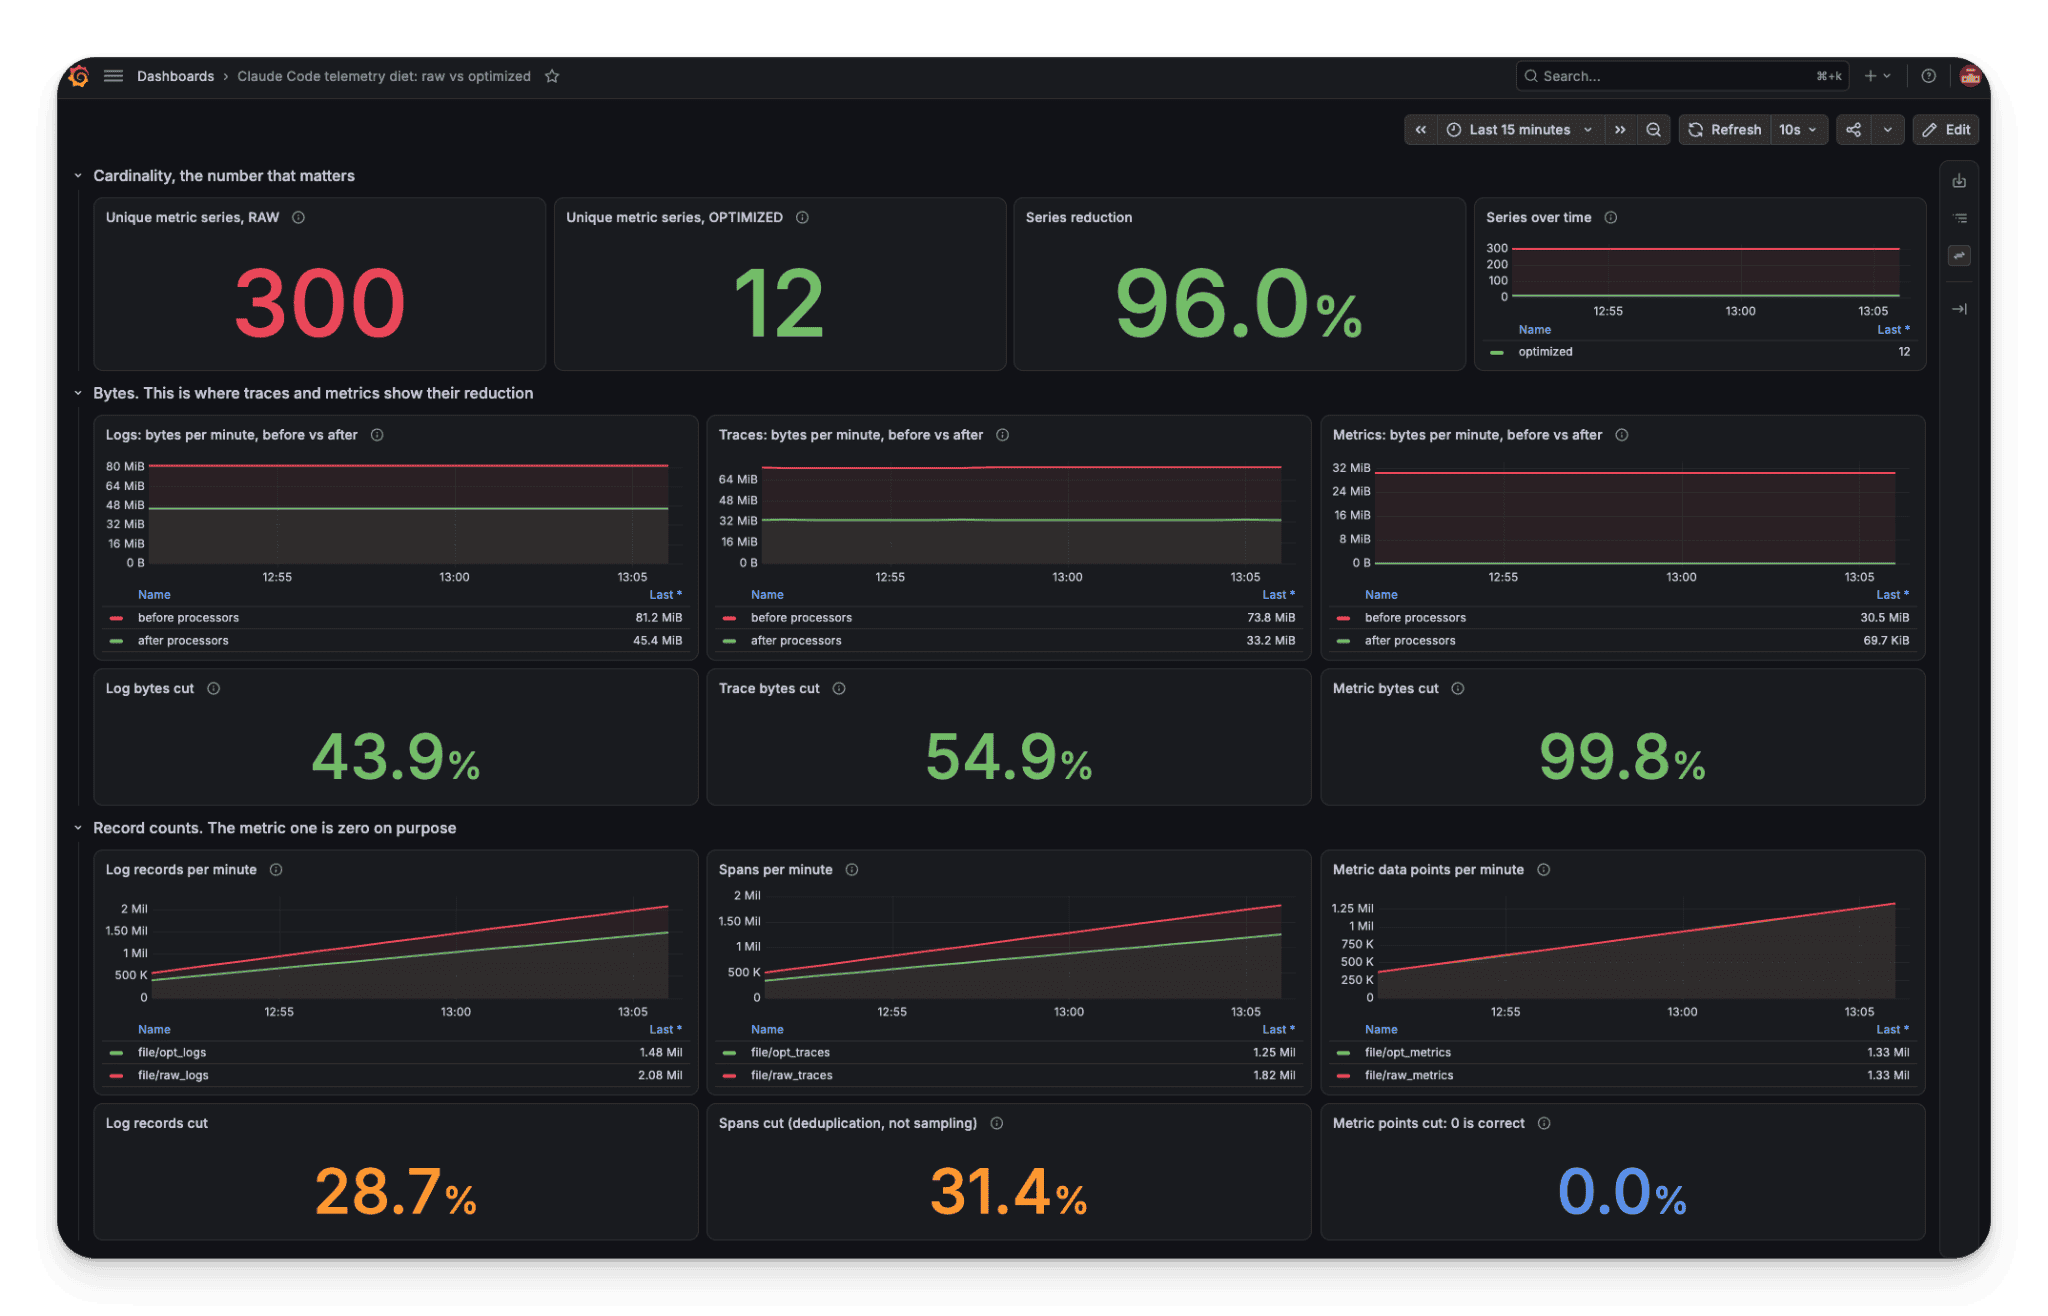
Rows compare series, signal bytes, and record counts; each measures a different kind of reduction.
Remove log content and metric dimensions
Logs first lose api_request events whose main information exists elsewhere. Prompt, response, tool_parameters, and host paths are removed while length trends remain. Session and user identifiers are SHA-256 hashed and shortened to 16 hexadecimal characters; errors are capped at 256 characters. Full 64-character hashes had increased bytes when replacing 36-character UUIDs.
Shortening identifiers is not anonymization. Deterministic hashes remain linkable and truncation introduces collision risk. Cross-signal correlation also requires consistent transformations; otherwise reduced bytes can break session investigation.
Removing six session/identity dimensions reduces metric series from 300 to 12, but deletion alone is insufficient. Delta points from different sessions now share series, while Prometheus needs cumulative data and the converter depends on timestamp order. The tutorial collects a two-second window, compacts resources, aligns timestamps, sums matching attributes, and only then converts delta to cumulative.
The author reports totals matching within approximately 0.5%. That validates the demonstrated windowing arrangement, not arbitrary distributed pipelines. All sessions must reach one Collector; behind load balancing, aggregation belongs at an appropriate single gateway or requires a separately designed partition-and-merge scheme.
Traces retain structure but lose information
The trace pipeline removes successful tool.execution child spans without error_class because parent spans retain tool name, duration, and result tokens. Transforms remove duplicate fields, keep generic gen_ai.* names, and attempt to remove commands containing credential patterns. Content, output, and diff are limited to 512 characters with a truncation marker.
This does not probabilistically sample whole requests, but it does delete spans and fields. No sampling does not mean no information loss. Code inspection also reveals that the example copies spanevent content only when it exceeds 512 characters, then deletes the original unconditionally. Copying that fragment literally may discard short content too. A deployment needs an explicit short-content retention branch and validation against actual events.
Optional tail sampling retains errors, slow traces, and 10% of the remainder with decision_wait 120 seconds. A multi-minute agent can fail after that decision. Handling late spans affects investigability, while waiting longer increases state-retention pressure. Savings alone are insufficient to choose a policy.
Validate answers, not just lower curves
The official dashboard shows 300 versus 12 series and illustrative byte reductions of 43.9% for logs, 54.9% for traces, and 99.8% for metrics. These are demonstrated traffic results, not fixed savings for every agent. Record counts, series counts, and bytes are different measures.
Detailed Collector self-telemetry and enabled sending queues expose exporter-level byte comparisons. The tutorial then checks the six operational queries. A fuller engineering check also covers total preservation, correlation, truncation markers, error samples, and long sessions. The advance is reduction guided by signal semantics: removing duplication and unnecessary dimensions can precede sampling, but every deletion remains constrained by the diagnostic tasks that must survive.
Processor order changes meaning
Merging sessions before delta-to-cumulative conversion is semantic. Converting first creates independent cumulative streams that can collide after identity removal. Removing labels without merging can feed overlapping points into one converter. Dropping a dimension changes whose counter a series represents, requiring a corresponding aggregation definition.
Aligned timestamps also compress timing into windows. That may suit cost totals or token trends but not brief spikes or precise temporal correlation. Matching totals does not establish preserved peak alerts. Total counts, time resolution, and event investigability should be evaluated separately rather than describing every reduction as lossless compression.
Acceptance checks should retain real operational questions and expected answers. Repeating those queries after configuration changes can expose semantic regressions from renamed fields or reordered processors before an incident reveals missing evidence.