An agent task can cross model calls, server tools, client tools, and several conversation turns. A final answer or aggregate API latency does not explain where time went or which failures should become repeatable evaluation cases. This Claude Platform update exports execution traces from Managed Agents, the Messages API, and SDKs through OpenTelemetry (OTel), reducing custom integration work across these views.
Official announcement: Agent observability on the Claude Platform
Anthropic · Published: 2026-10-14 · Companion documentation: OpenTelemetry for the Claude API
What a standard interface changes
The announcement introduces a public beta using GenAI semantic conventions and export to observability backends accepting standard OTLP. Teams with existing logs, metrics, and request traces can analyze model calls, tool use, latency, tokens, and identifiers in the same environment. The new capability connects execution evidence; automatic diagnosis and agent improvement still depend on backend analysis and evaluation design.
A trace records a request through the system, while a span represents one step. Explaining a slow task generally requires observing application logic, waiting, and tools around model execution. More isolated logs do not necessarily recover parent–child relationships. Spans with shared context place local events within a specific request.
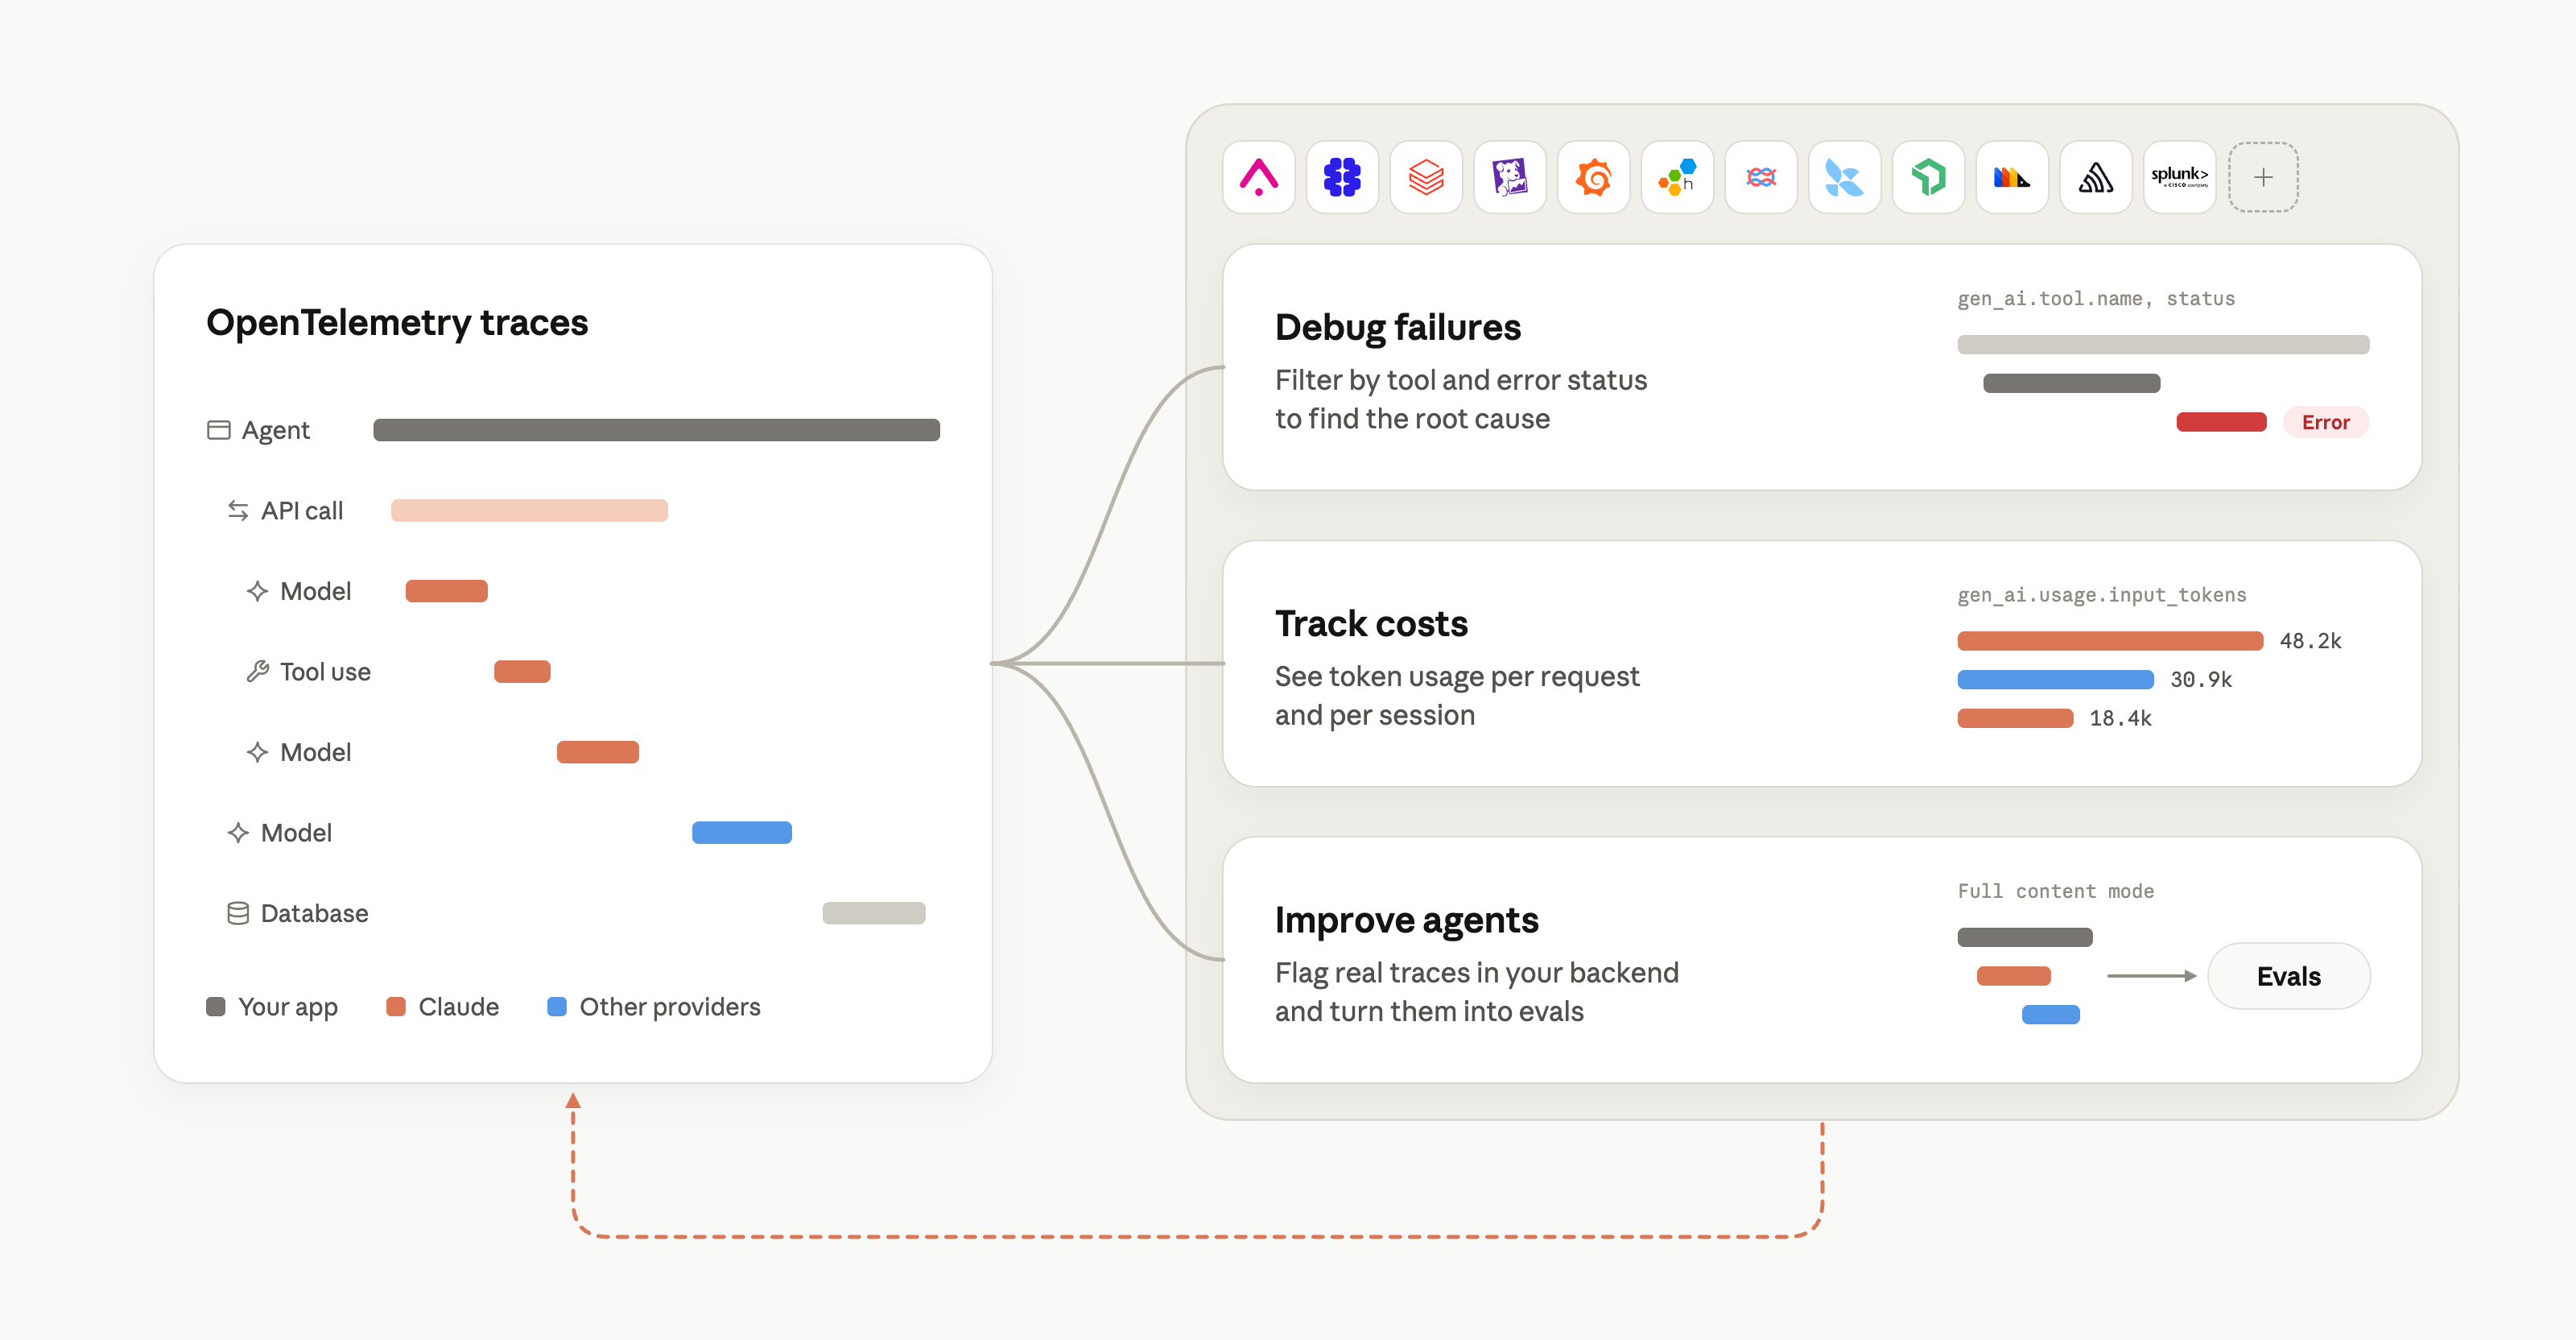
The left timeline combines application, Claude and other-provider steps; the right views use tool status, token usage and content for diagnosis and evaluation.
SDK and API tracing have different coverage
The documentation separates two paths. SDK tracing requires a registered tracer provider and observes client requests and local tools executed by the tool runner. API tracing requires an administrator to configure a destination in the Console and exposes server-side model runs, server tools, and Managed Agents turns. Enabling both connects the client call to internal service steps.
For example, a model might use server-side search before requesting an application-side weather tool. The client tool runner executes that tool and sends its result back. One user task then contains two Messages requests and a local tool in between. API-only tracing misses local execution; SDK-only tracing misses internal model runs. This is a coverage difference, not something solved by adding fields to every record.
The announcement’s description of automatic SDK export should therefore be read alongside the documented initialization requirements. Decide where the application root span starts and who emits client and server spans, then inspect whether a real task is connected end to end, rather than merely checking that new records appear.
Choose content visibility together with storage costs
The default metadata-only mode includes identifiers, timing, status, token counts, and application-supplied text such as agent/tool names and descriptions. Full content adds model inputs and outputs. Metadata supports latency, call-structure, and usage analysis; full content helps diagnose semantic failures and build evaluations. It also brings conversations under the observability platform’s access and retention policies.
The documented default content limit is 0.75 MB per span. Oversized content is shortened and marked with anthropic.content.truncated. Request spans drop system instructions and earliest messages first; tool spans drop blocks from the end of the result. Images and documents appear only as types. Even full-content tracing therefore does not guarantee reconstruction of a complete multimodal input or long conversation.
That directly affects diagnosis. If an omitted early instruction defined the task constraints, the retained tail can support a misleading interpretation. Include truncation status when selecting cases and set limits according to backend capacity. Higher limits preserve more context but increase transfer and storage demands; the diagnostic question should determine whether that trade-off is worthwhile.
A session is not necessarily one trace
Later Managed Agents requests may start new root traces, while multi-agent execution can have several threads. The documentation uses gen_ai.conversation.id to connect a thread and anthropic.session.id to aggregate the full session across traces. Time ordering helps read execution, but proximity alone does not establish causality.
An observability interface’s default request tree may therefore omit part of a task. Evaluating a multi-turn failure requires identifying session and thread boundaries before separating a model decision, tool output, and subsequent continuation. Otherwise, a case missing earlier context can be mislabeled as an unexplained model deviation.
Token counts can repeat across span levels
A Messages request can have both an SDK client span and an API server span, with model spans underneath. Usage may repeat at several levels. The documentation recommends choosing one source per request: prefer API when both exist, then count request-level or model-level usage, not both. Managed Agents uses model-request and outcome-evaluation spans.
Export retries can also duplicate spans, requiring deduplication by trace ID and span ID. Input-token counts already include cache-related tokens, so cache attributes must not be added again. Compaction has separate accounting rules. A visually more complete tree can produce a less accurate cost total if every node is summed.
More fundamentally, delivery is best effort: spans can be lost, and callers can suppress export through sampling flags. Traces are not a complete usage ledger. The Usage API is appropriate when complete API-key usage is needed. Missing observation and absence of activity must remain distinct.
Turning traces into evaluations still requires explicit labels
The official diagram sends real traces into evaluation, but that arrow requires additional work. A successful tool status does not establish that its content suffices for the task, and an error-free model call does not establish compliance with user constraints. An engineering inference from these collection capabilities is to use status and latency to select cases, combine necessary content with the task objective to label outcomes, and preserve inputs and expected behavior for repeatable evaluation.
This also avoids treating instrumentation coverage as a reliability score. New spans may expose previously invisible failures, increasing recorded errors without system regression. Comparing changes requires stable case definitions, content-retention conditions, and association rules, while separating instrumentation changes from behavior changes. OTel standardizes transport and field semantics; it does not define task success for the team.
Results and reading value
A Ramp customer example in the announcement reports that its Reflect system had reduced token usage by 10–20% and made sessions 30% faster on some agents. This describes an existing improvement loop, not an isolated causal effect of the new native OTel export. The announcement provides no controlled performance evaluation.
The development to watch is a standardized entry point for execution evidence. It helps operational diagnosis, cost analysis, and failure-case evaluation share the same history. Start with a specific question, such as which tool errors slow tasks, then establish whether the available spans, content, and session linkage can answer it. Observability supplies evidence; task correctness, appropriate permissions, and the effectiveness of a change still need independent criteria.