AMD and Embedded LLM · Official vLLM engineering report
Original: Scaling Kimi K3 on AMD Instinct MI355X: Matching NVIDIA HGX B300 Throughput per GPU on AgentX
Define the service target first
The headline comparison uses an InferenceX snapshot retrieved October 9, with AMD and NVIDIA submissions dated September 30 and August 16 respectively. Local optimization tests have separate configurations.
The article explains serving performance through caching, duplicate computation, memory movement, and parallel granularity. AgentX replays coding-agent request lengths, timing, and shared prefixes using synthetic tokens instead of private content. The workload has over 96% theoretical reuse with unlimited cache, and speculation uses fixed synthetic acceptance curves. It therefore compares complete serving stacks under particular session patterns, not universal hardware performance on arbitrary real prompts.
At 50 tokens/s/user P90 interactivity, the authors report approximately 7,567 total tokens/s/GPU on MI355X versus 6,083 on HGX B300, a 24.4% advantage. Interactivity is reciprocal P90 response inter-token latency and excludes TTFT. Total tokens include reused input and generated output, rather than output alone. Both use eight GPUs, TP8, FP4 weights, and FP8 KV, but differ in offload implementation, CPU cache budgets, software versions, concurrency, and speculation settings.
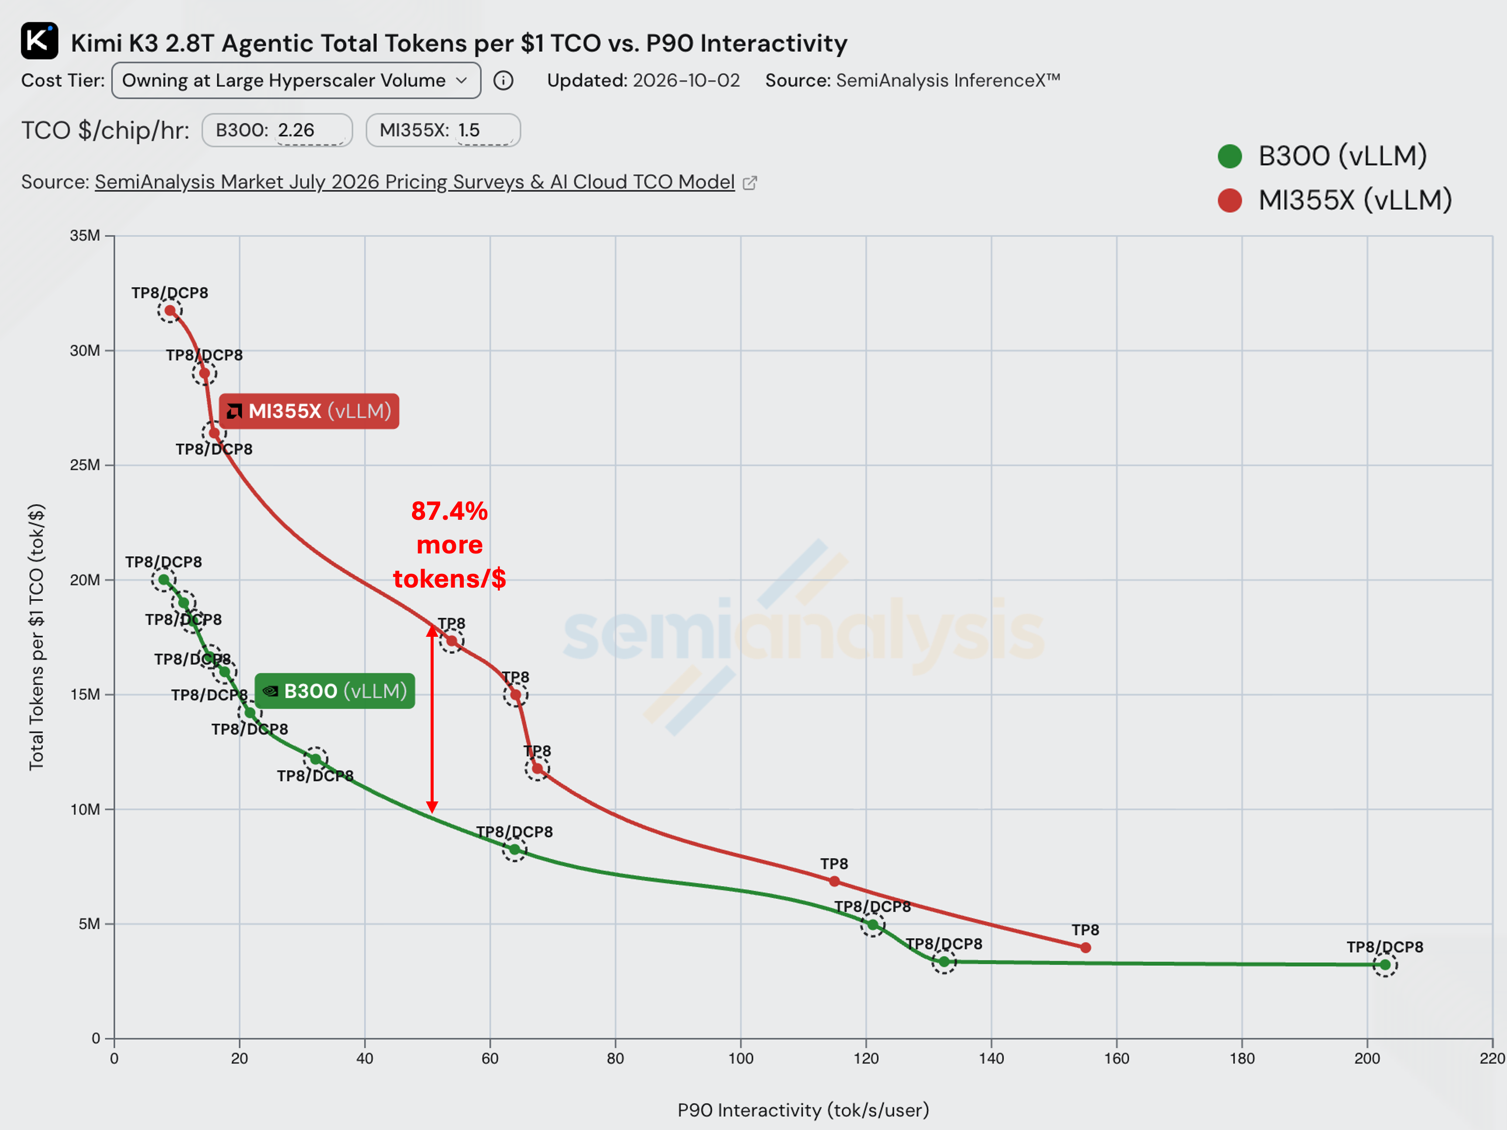
Reading the diagram: interactivity is on the horizontal axis and total tokens per dollar of TCO on the vertical axis. Compare curves at the same horizontal position. The red 87.4% depends on the displayed GPU-hour cost assumptions; it is not measured energy efficiency.
Reusable state must also support a consistent resume
Kimi K3 has 24 MLA layers retaining compressed KV that grows with context, and 69 KDA layers retaining fixed-dimensional recurrent state. TP8 divides query heads but can still replicate MLA history eight times. DCP8 further partitions positions: GPUs exchange queries, compute local attention, and merge results using normalization information. It primarily removes redundant storage; leading-order attention arithmetic remains roughly unchanged.
For 142,000 tokens, the article estimates 24 layers times 576 FP8 bytes per position, approximately 1.96 GB per GPU. DCP8 reduces this to about 245 MB, before allocation overhead. Saved capacity retains more history on GPU, while CPU offload preserves MLA history and KDA checkpoints that do not fit. Both state types need a shared resume position. In the illustrative example, MLA reaches 3,072 but compatible KDA state reaches only 2,048, requiring recomputation of the next 1,024 prefix positions. Saving attention-block tail state to align checkpoints makes a cache hit usable.
Remove repeated work before accelerating movement
The routed-expert output projection originally ran redundantly on eight GPUs. The optimization assigns output coordinates to ranks, adds each rank’s portion into shared-expert partials, and reuses the existing all-reduce to assemble a complete vector. Each coordinate contributes once without another collective. In separate tests on eight MI355X GPUs, TP8, concurrency 8–128, random 8K-input/1K-output requests, and prefix caching disabled, output throughput improves 3.05%–4.91%.
A later change loads only weight rows used by each rank, saving approximately 3.85 GiB/GPU across 92 MoE layers at TP8. It postdates the headline snapshot and cannot explain that headline’s gains. Its separate AgentX experiment uses TP8/DCP8, FP8 KV, 30-minute runs, no CPU offload, and no speculation. Gains are below 1% at concurrency 32 and 48 but reach 28.9% at 70, where prefix hits rise from 74.8% to 80.1%. This is consistent with extra capacity becoming valuable under pressure; repeated-run uncertainty and an equal-capacity control remain absent.
Within kernels, follow the actual consumers. Single-token KDA combines three compute kernels and two output copies into one HIP kernel, while convolution history and recurrent state still require persistence. Elsewhere, matrix-multiplication dispatch copied inputs before selecting an implementation, even though the fallback did not consume that copy. Moving copying into branches that use it removes 69 small copies per decode step. Each moved only 1,792 bytes but took approximately 4.8 microseconds: launch overhead, rather than byte volume, dominated.
Parallelism must match the actual shape
At TP8, each GPU has twelve MLA query heads. Padding to sixteen enables an AITER assembly path. Extra-head outputs are discarded, original heads independently compute attention, and KV history does not grow. On eight MI355X GPUs, TP8, concurrency 1, no DCP, MXFP4 weights, and BF16 attention, mean TPOT for 32K input/1K output falls from 43.8 to 23.6 ms. At 1K/1K it barely changes, from 22.9 to 22.8 ms. Distributing long history across more workgroups matters; short inputs gain little.
KDA’s recurrent dependency is addressed with group transformations: compute each token group’s combined rule, scan group summaries for starting states, then replay groups in parallel while preserving within-group order. This adds passes and increases launches from two to four, paying off mainly when independent work was insufficient. A separate backend comparison on eight GPUs, TP8, concurrency 32, prefix caching disabled, and one-token outputs reports 5.3%–5.6% higher input throughput at 4K/16K inputs.
Short speculative verification has another occupancy problem: twelve heads partitioned into 32-column tiles expose only 48 workgroups, while four-column tiles expose 384. In a single-MI355X graph-replay kernel test using TP8 dimensions, one sequence, and four verification positions, time falls from 16.20 to 5.61 microseconds per layer. The 2.89× includes narrower tiling and other specialization; it is not a system-level speedup. Numerically sensitive matrix inversion retains FP32 inputs and accumulation. FP32 accumulation cannot recover information already lost by rounding inputs to BF16.
Capacity also has discrete thresholds. The article explains that KDA preparation reuses Q/K scratch and stores only occupied triangular-matrix blocks, requesting approximately 79.5 KiB of LDS, allocated as 80 KiB. A MI355X compute unit has 160 KiB LDS, enough by capacity for two groups. Crossing an allocation increment can leave room for only one. Registers and other resources can further limit residency, so fitting two groups is a capacity check, not a claim of doubled throughput.
The headline software and memory conditions also matter: AMD uses vLLM 36768d1bf and NVIDIA 5894fdf98, with configured host caches of 224.875 and 281 GB per GPU respectively. Fixed synthetic acceptance, one hour of profiling, and excluded warmup help define the procedure, but the downloaded dataset revision is unrecorded, and closed-loop replay can complete different request mixes. The snapshot can support a full-stack comparison while leaving pure-hardware attribution and strict reproduction limited.
Costs and draft depth both need a complete denominator
The headline economics use large-hyperscaler ownership costs of $1.50 versus $2.26 per GPU-hour, yielding approximately 18.16 million versus 9.69 million tokens per dollar: 87.4% higher, or 46.6% lower modeled cost per token. Some capital and utilization assumptions are unpublished. These are not rental quotes or measured bills, and curve interpolation spans differing concurrency, DCP, and draft settings.
Draft depth likewise cannot be judged by acceptance alone. Under the fixed reference, three drafts yield 3.00 expected committed tokens per cycle and four yield 3.36, a 12% increase. Four drafts help only if the full draft–verify–commit cycle grows by less than 12%. The article does not measure that cycle growth here; it is an illustrative cost budget.
The article does not independently attribute every optimization’s contribution. Caching, fusion, and scheduling change one another’s bottlenecks, so multiplying peak gains from different tests does not predict the complete serving improvement.
The strongest reading value is the bottleneck investigation. Check compatible cache resume positions, duplicated work across ranks, unused temporary copies, and workgroup counts, then compare complete requests at the target interactivity. Local speedup ratios cannot be added, and changes made after a snapshot cannot retroactively explain its headline result.