Failures in AI clusters often appear first as lost output: a slow GPU, congested network segment, or NVMe drive degrading under load can stall an entire training job. Minerva’s significant move is to place component signals back into job context, asking which infrastructure issue is harming which workload instead of leaving network, compute, and scheduling teams to interpret separate dashboards.
Original: NVIDIA Unveils Minerva to Bring End-to-End Observability for AI Factories · Brian Sparks / NVIDIA · 2026-10-22
Additional source: Official datasheet
From device health to useful output
The announcement frames the objective as AI factory yield: effective GPU hours, goodput, cluster uptime, and token production. This is closer to useful outcomes than utilization alone. Busy equipment may be waiting, retrying, or doing work that never becomes usable output. Operational prioritization requires connecting component anomalies, affected workloads, and lost production.
Minerva collects GPU, network, storage, scheduler, and workload information. The datasheet additionally lists Spectrum-X, NVLink, SuperNICs, DPUs, NCCL, and Slurm, with ingestion through OpenTelemetry, gRPC/gNMI, syslog, and DCGM. Multiple interfaces reduce integration friction; they do not automatically resolve inconsistent device identities, sampling rates, or missing logs.
The graph supplies analytical context
The platform organizes GPUs, switches, cables, and active jobs into a dynamic knowledge graph. Filtering underlying logs, metrics, and anomalies by job ID can turn an anomalous interface into a set of potentially affected communication paths and workloads. This matters for gray failures: a component is degraded rather than completely unavailable, and an isolated threshold alarm does not explain the distributed slowdown.
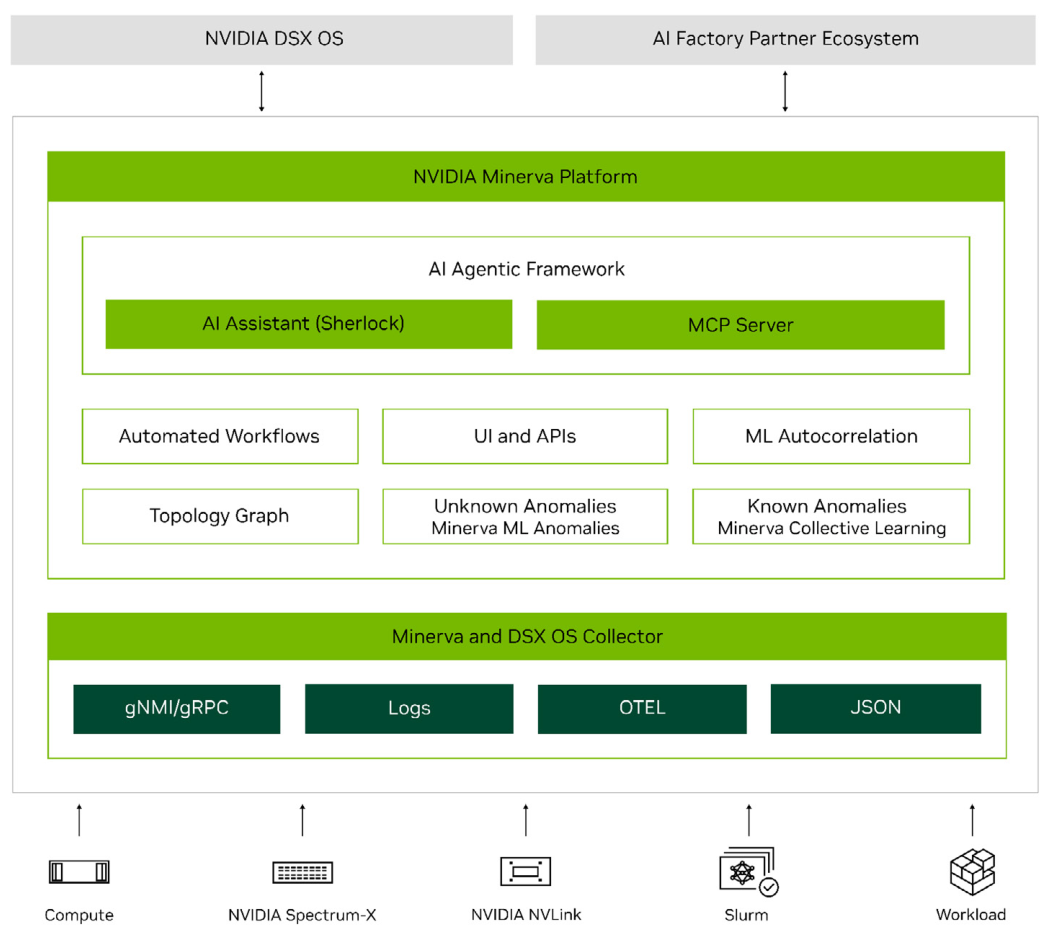
Reading the diagram: the collector ingests infrastructure and workload signals at the bottom. Topology, anomaly detection, and correlation occupy the middle. Workflows, Sherlock, and MCP expose investigation and remediation capabilities above them.
The official description combines supervised and unsupervised models: known patterns identify familiar errors, deviations from normal behavior reveal unfamiliar anomalies, and dependency relationships connect events. The objective is to consolidate cascading symptoms into an incident with a likely cause. Its usefulness depends on whether the graph follows scheduling and network changes; stale relationships can attach symptoms to the wrong component.
Engineering evaluation should therefore pair notification reduction with missed-incident risk. Consolidation can ease on-call work, but excessive merging can hide concurrent independent failures. Useful acceptance questions include which raw evidence belongs to an incident, why it was connected, which competing explanations remain, and whether suppressed alarms remain traceable. These questions follow from the architecture; the announcement supplies no corresponding false-positive or false-negative rates.
Natural language sits above live evidence
The native Sherlock assistant uses live telemetry and the cluster graph for queries, debugging, and remediation recommendations. An MCP server exposes related capabilities to external agents. The improvement is a common investigative entry point: an operator can move from a job symptom to related devices and anomalies without repeatedly rebuilding context.
Explanation and execution remain separate layers. The official materials support human implementation of recommendations or automated mitigation through scheduler, SuperNIC, switch, and external automation interfaces. For node draining, anomaly detection identifies a reason to act, while scheduling must still account for replacement capacity, migration eligibility, and whether useful output recovers afterward. The graph supplies context rather than replacing operational constraints.
The datasheet lists RBAC, SSO, multi-tenancy, and high availability. Integrators still need distinct configurations for what assistants may read and what automation may modify. MCP establishes connectivity, not proof of sufficient authorization. Retaining the recommendation, approval, and execution outcome in the incident record makes it easier to tell whether automation reduced diagnosis time or merely generated actions faster.
What the release establishes
NVIDIA describes analysis of billions of data points per hour and deployments spanning hundreds of thousands of GPUs. IREN is named as a user, with several other partners planning deployment. These establish positioning and adoption signals. The public material does not provide a common experimental protocol, baseline, false-alarm statistics, or complete comparative MTTR study, so it does not quantify an output improvement. Qualitative benefits in the datasheet remain vendor claims.
Deployment options range from the Collector alone, through Minerva analytics alongside existing observability tools, to a full installation. It supports on-premises deployment and DSX OS integration. The choice is therefore also about which collection and topology responsibilities remain with an existing stack. Teams with substantial observability investment need to examine duplicate ingestion, storage costs, and graph-maintenance ownership.
Testing the loop with a slow-job scenario
Consider an illustrative training job with periodic stragglers and lower GPU utilization but no fatal device error. An operator could identify participating nodes and communication relationships by job, then examine nearby interfaces, storage latency, and scheduler events. If affected jobs share a link, topology narrows the candidate set. Without that relationship, temporal coincidence alone should not merge them into one incident.
Intervention also needs interpretation. Recovery after draining a suspected node strengthens a hypothesis, but simultaneous load changes may explain it too, so before/after conditions should remain available. This is an engineering scenario derived from the product structure, not an experiment reported by NVIDIA. It turns a root-cause recommendation into a question about supporting and contradicting evidence.
Cluster and individual-job health also differ. Stable aggregate throughput can hide damage to an important job; accelerating one job can consume another tenant’s resources. Job-centric observation used for scheduling should therefore retain capacity and affected-tenant context. The graph then informs prioritization rather than simply placing more data on one screen.
For teams with existing Grafana or ticketing systems, integration should carry evidence and ownership into established workflows. An exposed interface is only the beginning: consistent incident identifiers, original queries, and action outcomes determine whether cross-platform investigation remains traceable.
The reading value is the productization of job–infrastructure correlation. Track whether gray failures enter investigation earlier, whether consolidation preserves traceable evidence, and whether mitigation restores useful work. The Collector/Platform split, job-ID relationships, and action interfaces are more informative starting points than the advertised scale alone.