Kevin Lee, Yashar Bayani, Ahmed Sharif, Yee Jiun Song · Meta Engineering · 2026-10-19
Original: Inside Prometheus: Meta’s Journey to a Gigawatt-Scale Supercluster
The most useful part of Prometheus is how Meta keeps an operating fleet productive, rather than its eventual million-GPU ambition. The article connects networking, spares, checkpoints, hardware screening, and power control. Whether one failed component stops an entire job can matter more to training duration than that component’s peak speed. Phase one is complete; roughly one million GPUs remains the full-scale target.
Network hierarchy follows training communication
Communication within a data-parallel replica is more latency- and bandwidth-sensitive than communication between replicas. Prometheus therefore uses fast building-level fabrics and a Backend Aggregation network between buildings. BAG spans about 2 km to more than 100 km. Switching improvements cannot remove propagation delay, so training parallelism must also follow physical topology.
One building fabric connects up to 20,736 GPUs. The earlier DSF design uses fine-grained multipath routing, reordering, virtual output queues, and credit-based flow control to handle collisions among long flows. Once NICs could reorder at endpoints, the design moved toward NSF with shallow-buffer switches. Performance and reliability depend on where congestion control and ordering responsibilities live, not simply on bandwidth.
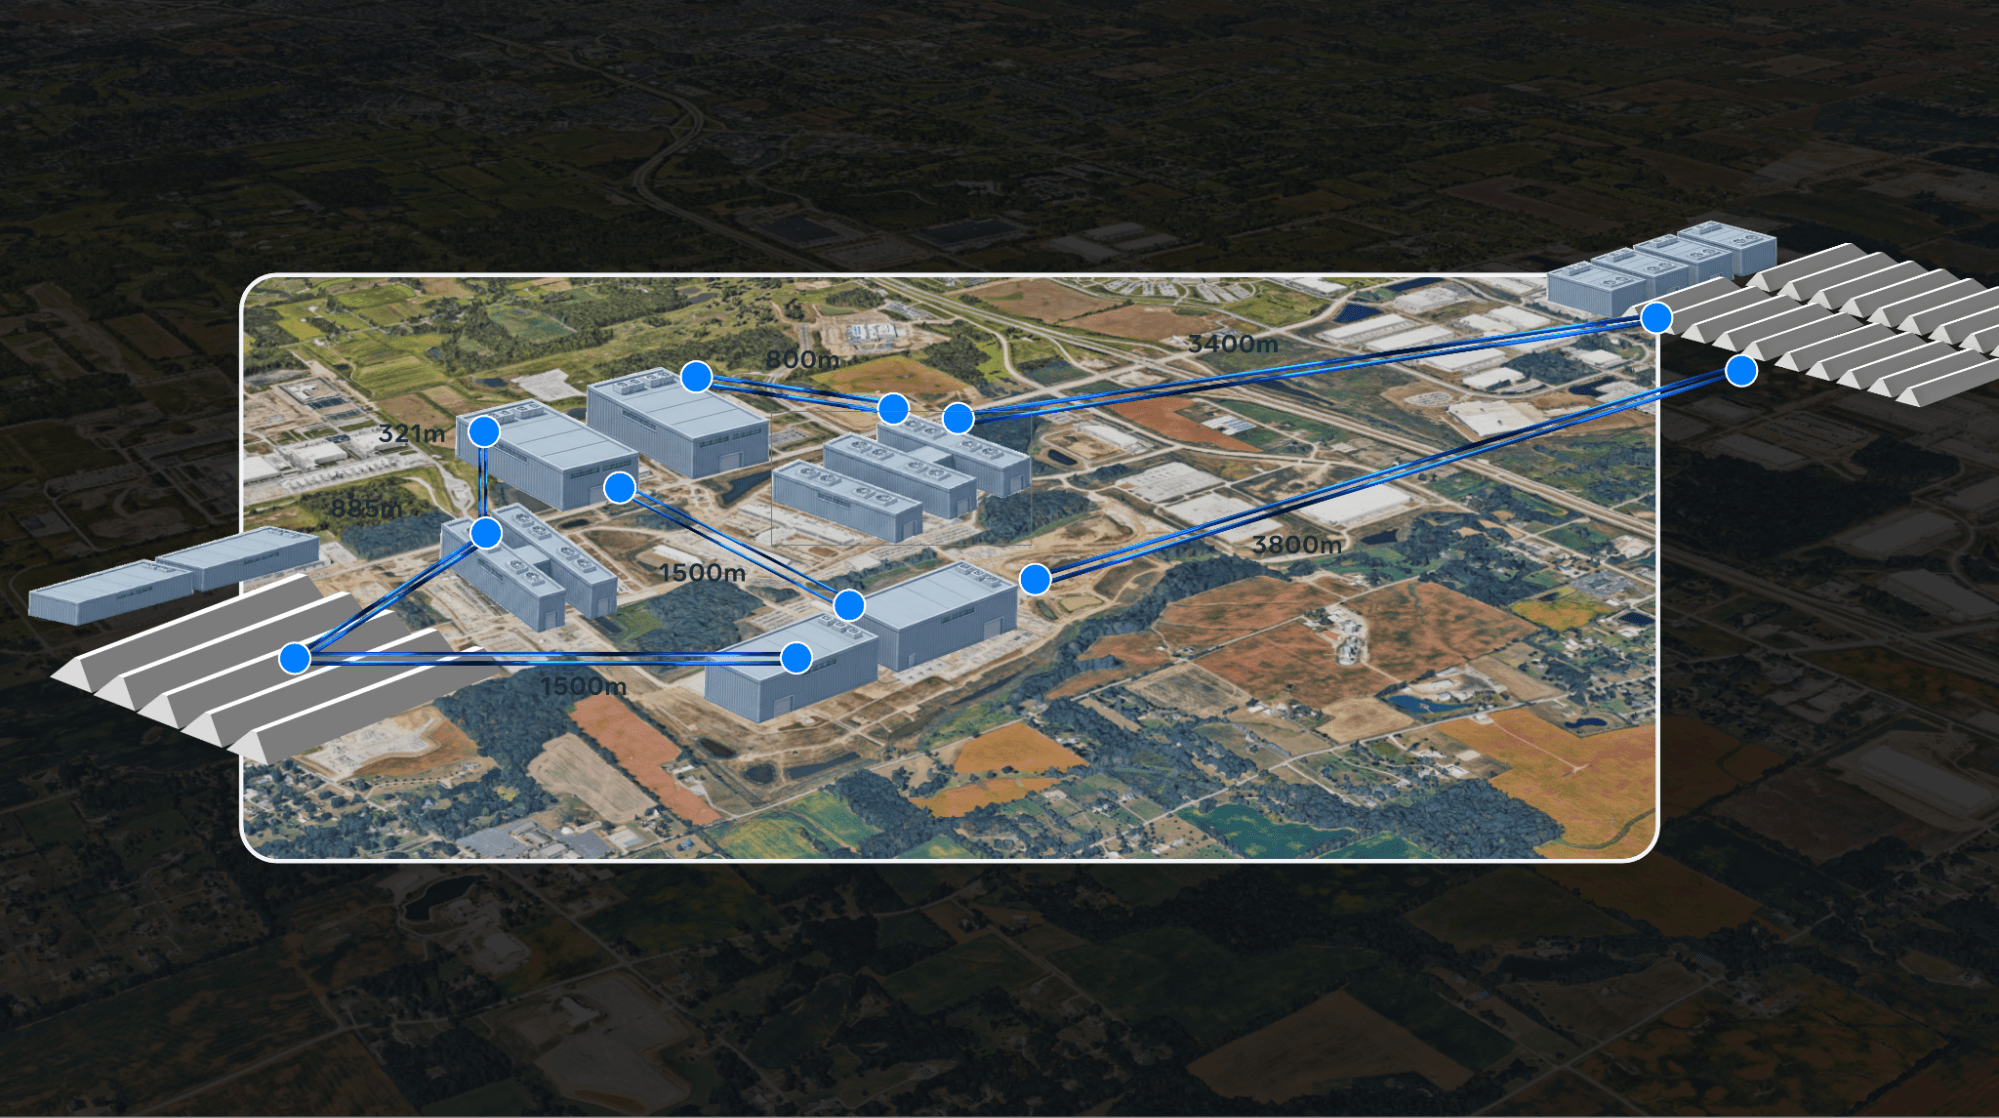
Blue links connect separate buildings. Their physical distances motivate different arrangements for cross-building traffic and tightly coupled local communication.
Catalina’s GB200 Ariel configuration spreads 72 GPUs across two racks and supplies two 400G NICs per GPU for early 800G scale-out. The authors explain that faster compute, HBM, and scale-up would otherwise expose external bandwidth as a bottleneck. The subsequent GB300 platform supplies native 800G and fits a 72-GPU domain in one rack. Hardware generations change networking and serviceability alongside peak FLOPS.
Why spare GPUs are not simply wasted capacity
Moving from NVL8 to NVL72 expands the tightly coupled domain ninefold and increases its potential failure radius. Meta uses 64 active GPUs and eight in-domain spares, matching power-of-two training groups, plus approximately 2% spare racks for whole-rack failures. A failed GPU can be replaced from the spare pool without waiting for physical repair.
The concrete example provisions 523 NVL72 racks, or 37,656 GPUs, for 32,768 active GPUs. The article calls this approximately 13% above active capacity, but its listed counts imply approximately 13% spares relative to total provisioning and 14.9% additional provisioning relative to active GPUs. Those denominators should not be mixed. Much of the margin follows from 64-of-72 geometry rather than a separately purchased reliability premium.
The trade-off concerns useful output. Fewer spares raise nominal utilization, but making tens of thousands of GPUs wait for repair can lower goodput. It also depends on failure distribution: in-domain spares cannot repair an event that removes the entire power or network domain. Rack-level reserves and recovery mechanisms remain necessary.
Recovery follows the failure boundary
PAFT handles failures that can be isolated to one data-parallel replica. Other replicas repeat the current step and continue while the affected replica restarts on spare hosts and resynchronizes. The cost becomes a temporary throughput reduction rather than a global halt. Broader failures require the whole job to restart from a checkpoint.
Checkpointing saves state asynchronously to multiple storage tiers, using incremental saves and in-memory staging to reduce normal-operation cost. Spares shorten hardware replacement readiness, checkpoints reduce lost progress, and PAFT reduces the events requiring global recovery. These are complementary functions. Repaired hardware also undergoes quarantine and validation before returning to the pool.
Read results as productive training time
Meta reports more than 85% pretraining goodput and more than 90% RL goodput for Muse Wonder runs. MTBI during those runs was approximately 47k GPU-hours; subsequent fixes, including firmware changes, raised it above 54k. GPU-hours is a device-normalized measure, not a claim that a whole large job ran uninterrupted for tens of thousands of hours.
The team also reports a 99% interruption reduction from an early peak in mid-2025 of almost 1,000 events per 8K GPUs per day. This spans hardware introduction and maturation, including NVLink screening, memory firmware and correction, fabric recovery, network rerouting, and operational coordination. It cannot be attributed to a single algorithm. Two interruptions per 8K GPUs per day, approximately 100k GPU-hours MTBI, remains a target rather than an achieved result.
Power transients belong in reliability engineering
Synchronized training switches many GPUs between compute and communication together; the article describes 30–40% power transients. Dynamo Dimmer gradually caps GPU power near the electrical limit instead of stopping jobs. Rack batteries, capacitive buffering, and facility storage address different timescales. Cooling and repair quality belong in the same feedback loop because thermal and power failures ultimately reduce training progress.
From attribution to verified repair
The article treats NVLink signal integrity, HBM/LPDDR, switch fabrics, and backend networks separately instead of labeling every training interruption a failed GPU. Link screening distinguishes transient events from persistent signal-quality problems requiring different repair actions. Repeated fleet-level memory-error patterns guide firmware settings, scrubbing, and proactive retirement. Reliable classification determines whether repair effort addresses the largest losses.
Fix propagation is another useful metric. The team reports deploying firmware and driver fixes to more than 100k GPUs within hours, and reducing P90 single-pod upgrade time from over seven hours during early introduction to two hours. A working fix deployed slowly leaves many devices exposed to known failures. Rollout efficiency is therefore part of reliability, while faster upgrades still require validation and post-repair quarantine.
A transferable assessment follows from this practice: identify the active replicas affected, measure progress and time lost during recovery, then account for spares and maintenance capacity. Equal interruption counts can cause very different compute losses under local recovery versus full-job checkpoint rollback. Device availability alone can overvalue GPUs busy recovering and undervalue spares that shorten recovery.
These metrics also come from different observation periods. Interruption reduction starts with hardware introduction, goodput concerns particular model runs, and MTBI changes after later firmware updates. They are not three readings from one experiment. Keeping that timing clear avoids treating improvement from an early peak as a repeatable gain for every job on a mature platform.
This is an industrial operations account. Its transferable lesson is to connect metrics to failure domains and consider interruption frequency, recovery time, spare capacity, and goodput together. It does not isolate each contribution experimentally or provide the full training-job distribution. Layered recovery and attribution are useful ideas; the spare ratio should not be copied directly into systems with different scale and failure structure.