A successful backend request does not necessarily mean a user completed an operation. A broken browser script, a wait on a weak connection, or a missing confirmation can fall outside backend availability metrics. The useful shift in this Datadog article is to organize reliability around a complete user journey, then observe it through both real user monitoring (RUM) and synthetic tests. The question is whether the measurements represent what users encounter, rather than how many green indicators a dashboard collects.
Original: Build better SLOs with RUM and synthetic SLIs
Addie Beach, Andy Amick · Datadog · 2026-10-20
Preserve the two questions
Scheduled synthetic tests exercise controlled paths and ask whether a journey can still complete. RUM observes actual sessions and asks whether people succeed and how long operations take. The article connects these views through Journey Monitoring, which it describes as Preview. The development is a workflow for organizing reliability evidence around journeys; it does not establish a new detection algorithm or a general accuracy improvement.
An engineering design should retain both evidence streams. A failing probe with healthy user traffic may point to the test account, location, or script. Poor user outcomes with healthy probes may expose an uncovered device or input. Disagreement is a reason to investigate. Averaging the signals would erase useful distinctions.
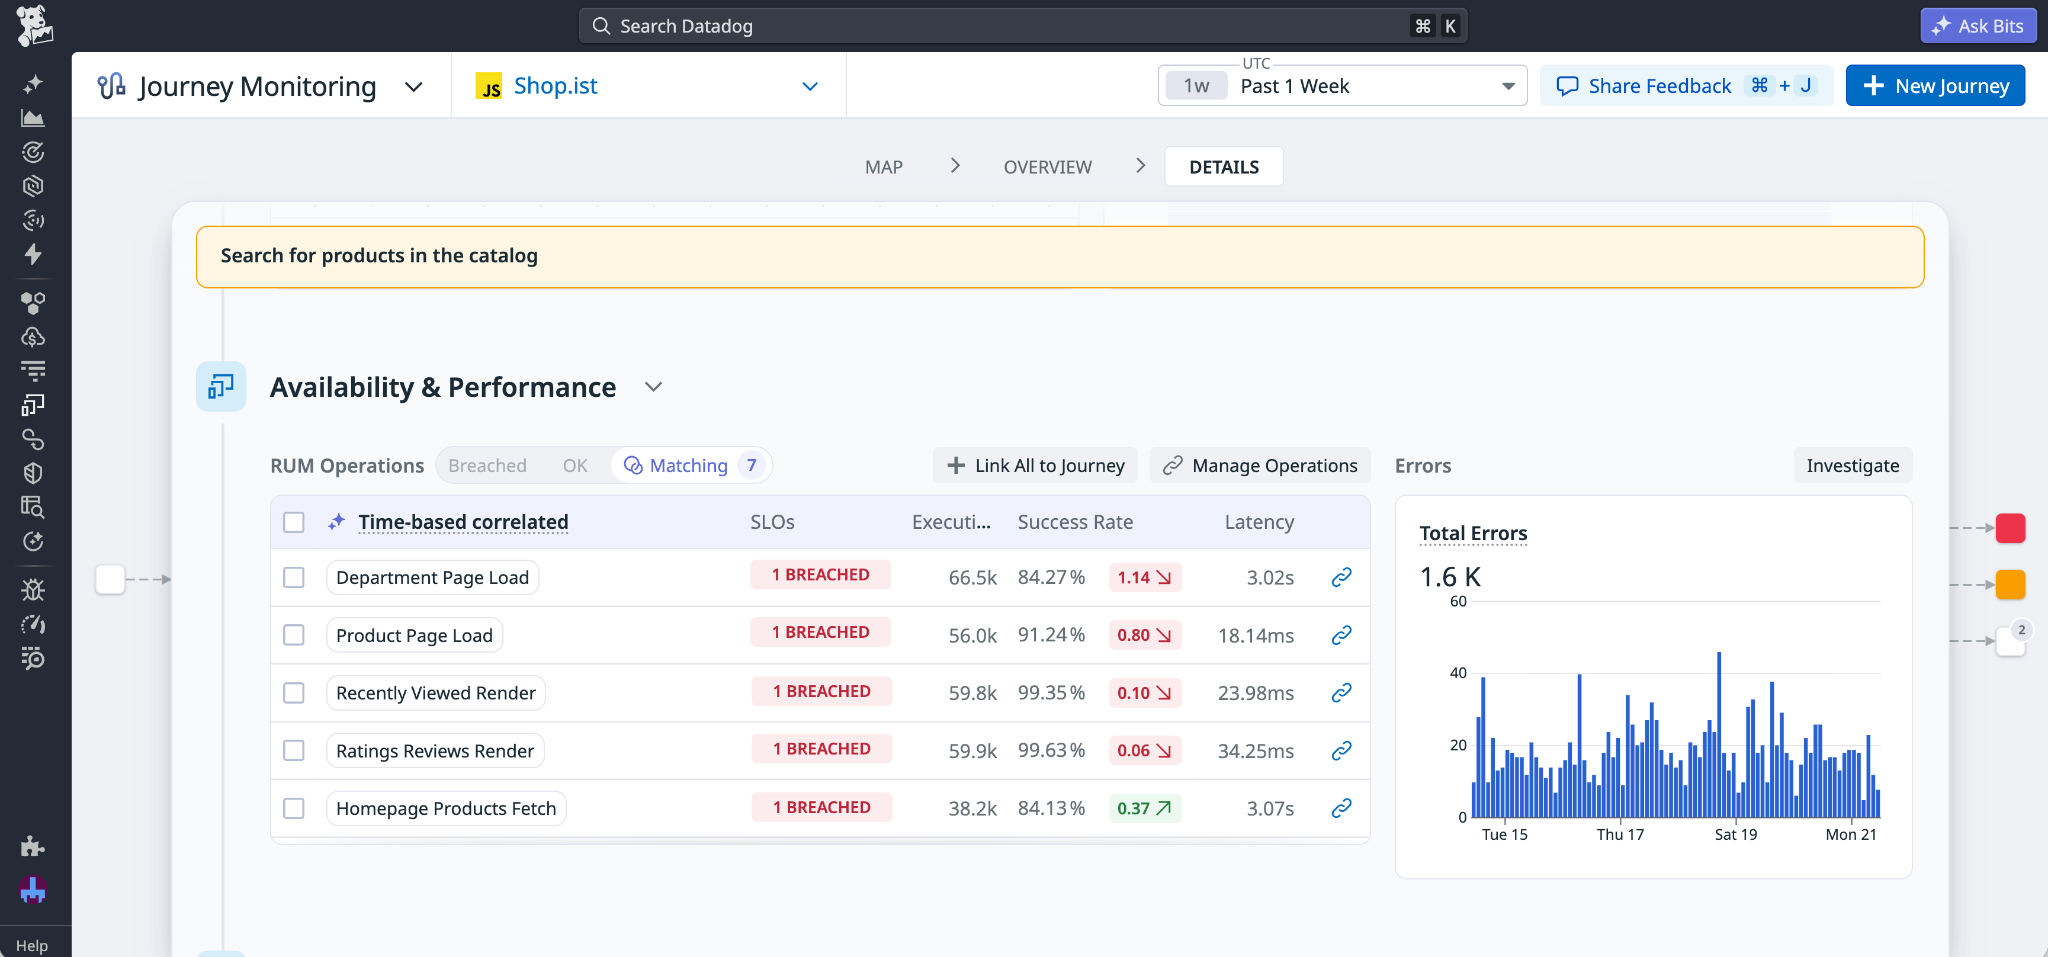
Read the operations within the journey, then compare their success rates, latency, and SLO states. This is an official product example, not a performance evaluation.
Define the denominator before the target
The metric-based SLO documentation calculates an SLI from good events and all included events over a window. Queries must use matching operation, environment, and population filters; otherwise their ratio may not describe the same request population. Event weighting also gives busy periods more influence. It is not interchangeable with the fraction of minutes classified as healthy.
Consider a hypothetical example: 990 successes and 10 failures in the morning, followed by 1 success and 1 failure overnight. Averaging the two success rates gives 74.5%; aggregating the events gives approximately 98.9%. These answer different questions. An operation-success objective needs the corresponding event denominator. Continuous availability needs a separate time-based definition. Switching denominators to obtain a better number changes the objective.
The RUM operations guide further distinguishes outcomes. Availability excludes abandonment and counts timeouts as failures. Latency counts abandonment beyond the threshold as bad, but excludes timeouts without a reliable completion duration. These definitions separate slowness from failure instead of treating every incomplete operation identically. A site with different business semantics should first check that its instrumentation matches these definitions.
Match measurement resolution to the promise
The monitor-based SLO documentation calculates reliability from time spent in an alert state, constrained by minute-level evaluations. A seven-day window with a hypothetical 99.999% target permits only about 6.05 seconds of downtime:
One minute-long state change exceeds that entire budget. This arithmetic demonstrates a mismatch between the promise and measurement capability; it is not a recommendation to configure unsupported precision. Test intervals, retries, and alert confirmation also affect when a failure state starts. Failed test counts and time in alert are different measurements.
Time Slice SLOs evaluate metric conditions over 1- or 5-minute slices without an intermediate monitor, but still discretize time. Their documentation also treats missing data as uptime. A green SLO therefore needs a collection-health check alongside it, or a telemetry interruption could look like recovery.
Make the journey traceable to operations
A practical design sequence is to choose a critical business path, define its start, completion, and failure conditions, and model its important technical operations separately. For example, completing payment might require successful submission and receipt of confirmation, rather than a button click. This is an engineering example, not a claim that the product automatically understands every business completion condition.
Use a controlled test to exercise the end-to-end path, then real operations to measure experience across devices, regions, and traffic mixes. During diagnosis, distinguish common degradation from a problem limited to one population, then inspect the associated operation errors and latency. Keeping each signal’s window and denominator explicit explains why one alert fired while another did not.
Low traffic cannot be addressed only by widening the window. A longer window stabilizes ratios but slows detection. More frequent probes reduce observation gaps while adding cost, and they do not automatically cover a new user path. The trade-off depends on failure duration, business sensitivity, and diagnostic capability, rather than one universal test frequency.
Match the response to the measurement
An easily missed trade-off is that global ratios and local experience can both be correct while suggesting different priorities. Suppose a release affects only a small population using older browsers. The overall success rate may barely change even though those users cannot complete a critical operation. Segmentation should clarify whether the service promise concerns only the population average or also protects important user groups, rather than merely finding the worst number.
Conversely, more dimensions leave fewer samples in each group and amplify fluctuations from isolated failures. Alerts should show event counts, affected populations, and duration alongside percentages. Business criticality and corroborating synthetic failures can inform urgency; a threshold without context cannot replace that judgment.
Recovery semantics matter too. After a fault ends, a long-window budget may remain depleted while the short window stops deteriorating. The former informs subsequent release decisions; the latter helps determine whether the incident is still growing. Distinguishing service recovery from budget recovery prevents two different questions from being debated as one.
What is worth adopting
This is an article about measurement design and a product workflow. Its public evidence does not show that a particular combination universally reduces MTTR. The transferable idea is to define real experience and controlled reachability separately, then bring their evidence together on one journey. Before adoption, replay a known incident conceptually: did it enter the correct denominator, consume the expected budget, and lead from a breach to an identifiable operation? That establishes more about an SLO’s usefulness than another aggregate percentage.